
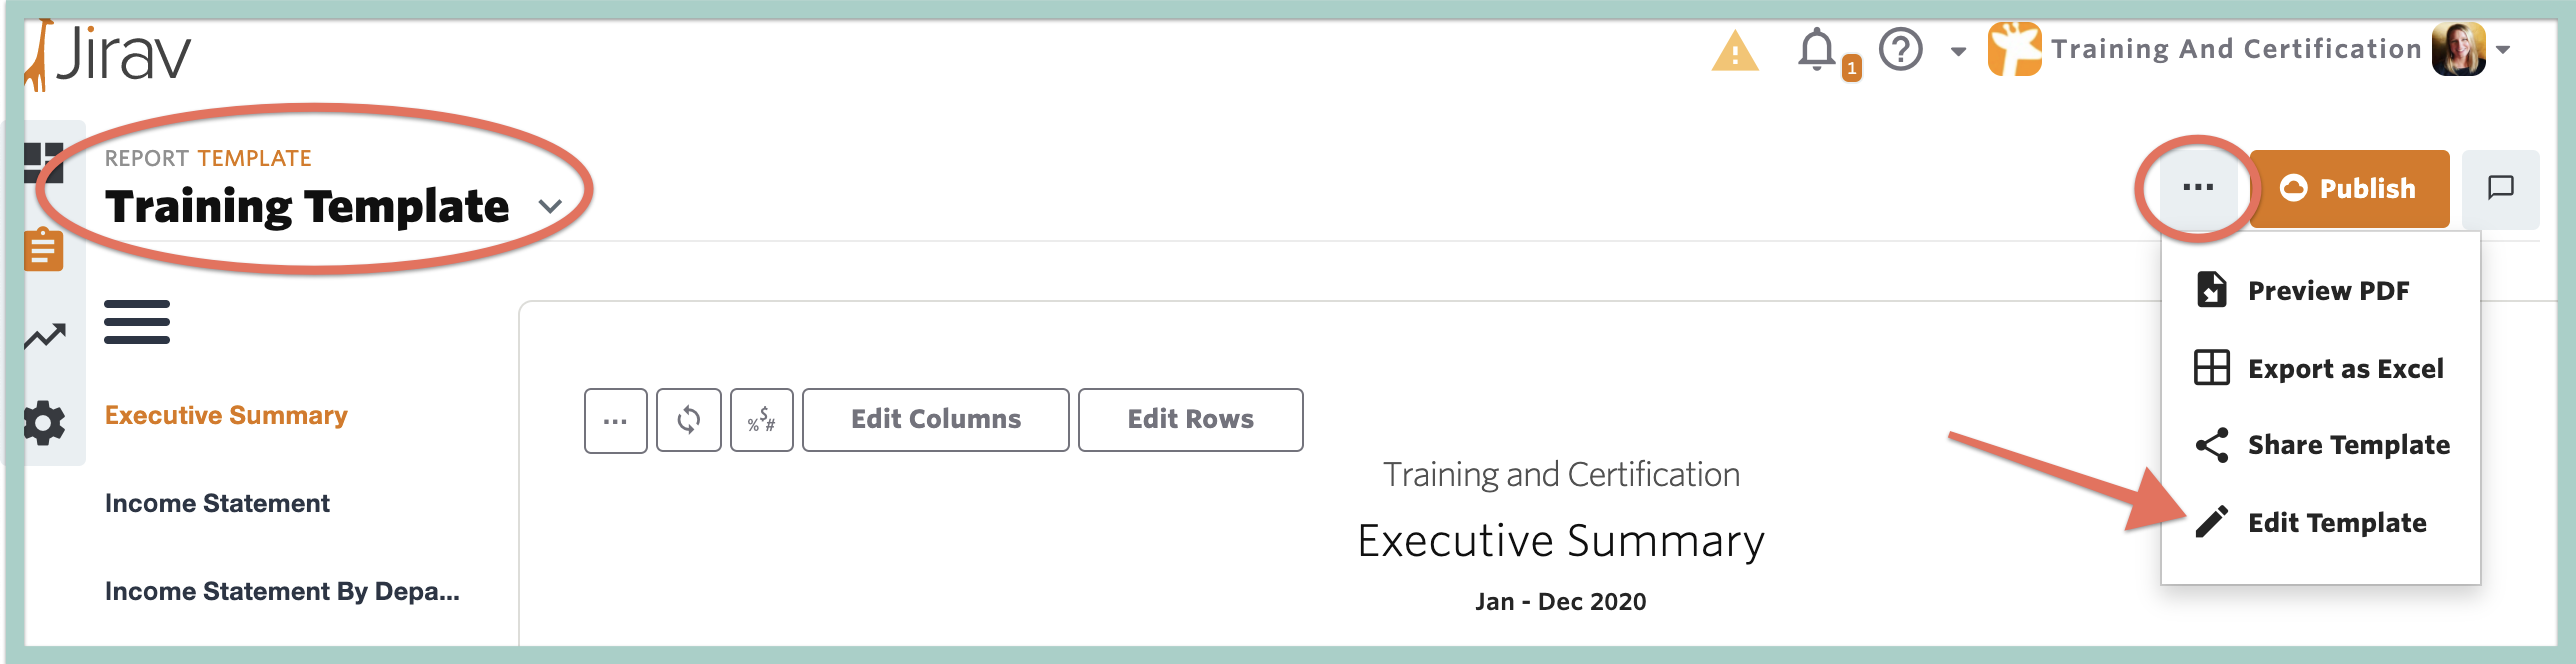
Create and tailor a custom report template to be published, shared, and commented on
Report Templates enable you to create a group of custom reports to simplify your financial reporting process and empower company stakeholders by providing them with up to date information. For example, you might have a Month End Reporting Template that you share internally each month and then a Quarterly Review Reporting Template to present to your board quarterly.
In this step you will learn the following concepts:
Add & Remove Reports from the Template
The report template enables you to customize the financial information you share with each company stakeholder. Upon creation, the template will automatically include several reports included in it.
To customize the reports in your template, choose the Training Template from the Report Template dropdown > . . . > Edit Template.
Then, complete the following modifications to the reports included in the template:
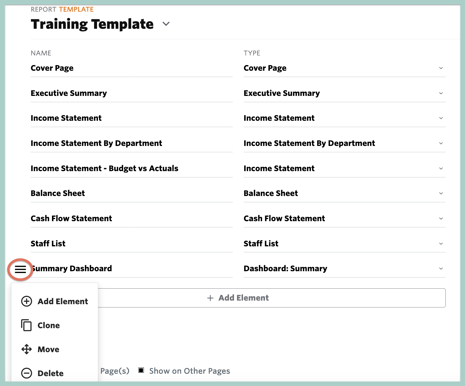
- Select + Add Element to add the following reports:
* Assumes that a Summary Dashboard has been created as defined in this article.Name
Type Cover Page Cover Page Income Statement - Budget vs Actuals Income Statement Summary Dashboard Dashboard: Summary* - Select (-) Delete for the following reports by hovering to the left of each Report Name to activate the context menu:
Name
Type Goals Goals Custom Custom Workforce Workforce - Move the reports within the template by hovering to the left of the Report Name to activate the context menu and selecting Move so that they appear as below and Save.
Once the Training Template is Saved in Edit mode, you'll be brought back to the template View mode.
Customize Reports within the Template
All reports within your Template will have default settings and may or may not need further modification. In this step, you will customize the Cover Page, Executive Summary, Income Statement - Budget vs Actuals & Staff List reports and leave the remaining reports with the default settings.
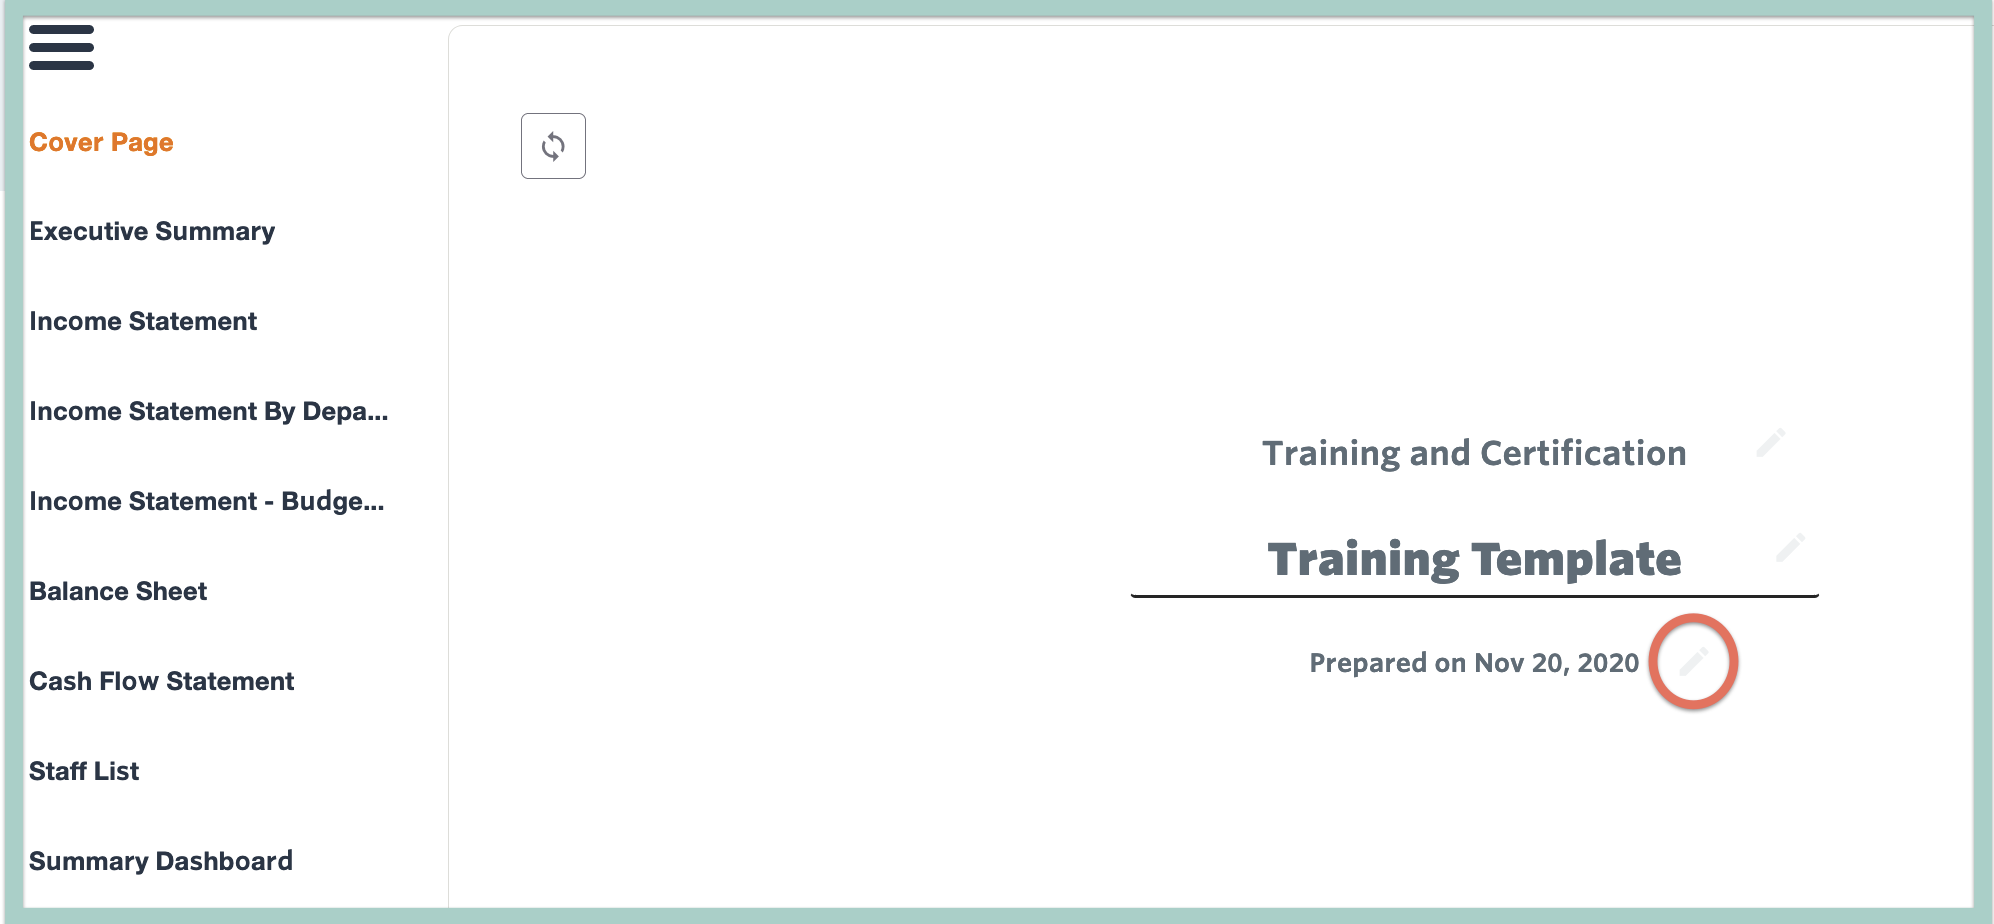
Cover Page
The Cover Page will automatically show the company name, report template name and prepared on as of the current date. The Prepared on date should be updated prior to publishing your report to reflect the date the report was actually prepared on. Edit the date by selecting the pencil icon to the right of the date.
Executive Summary
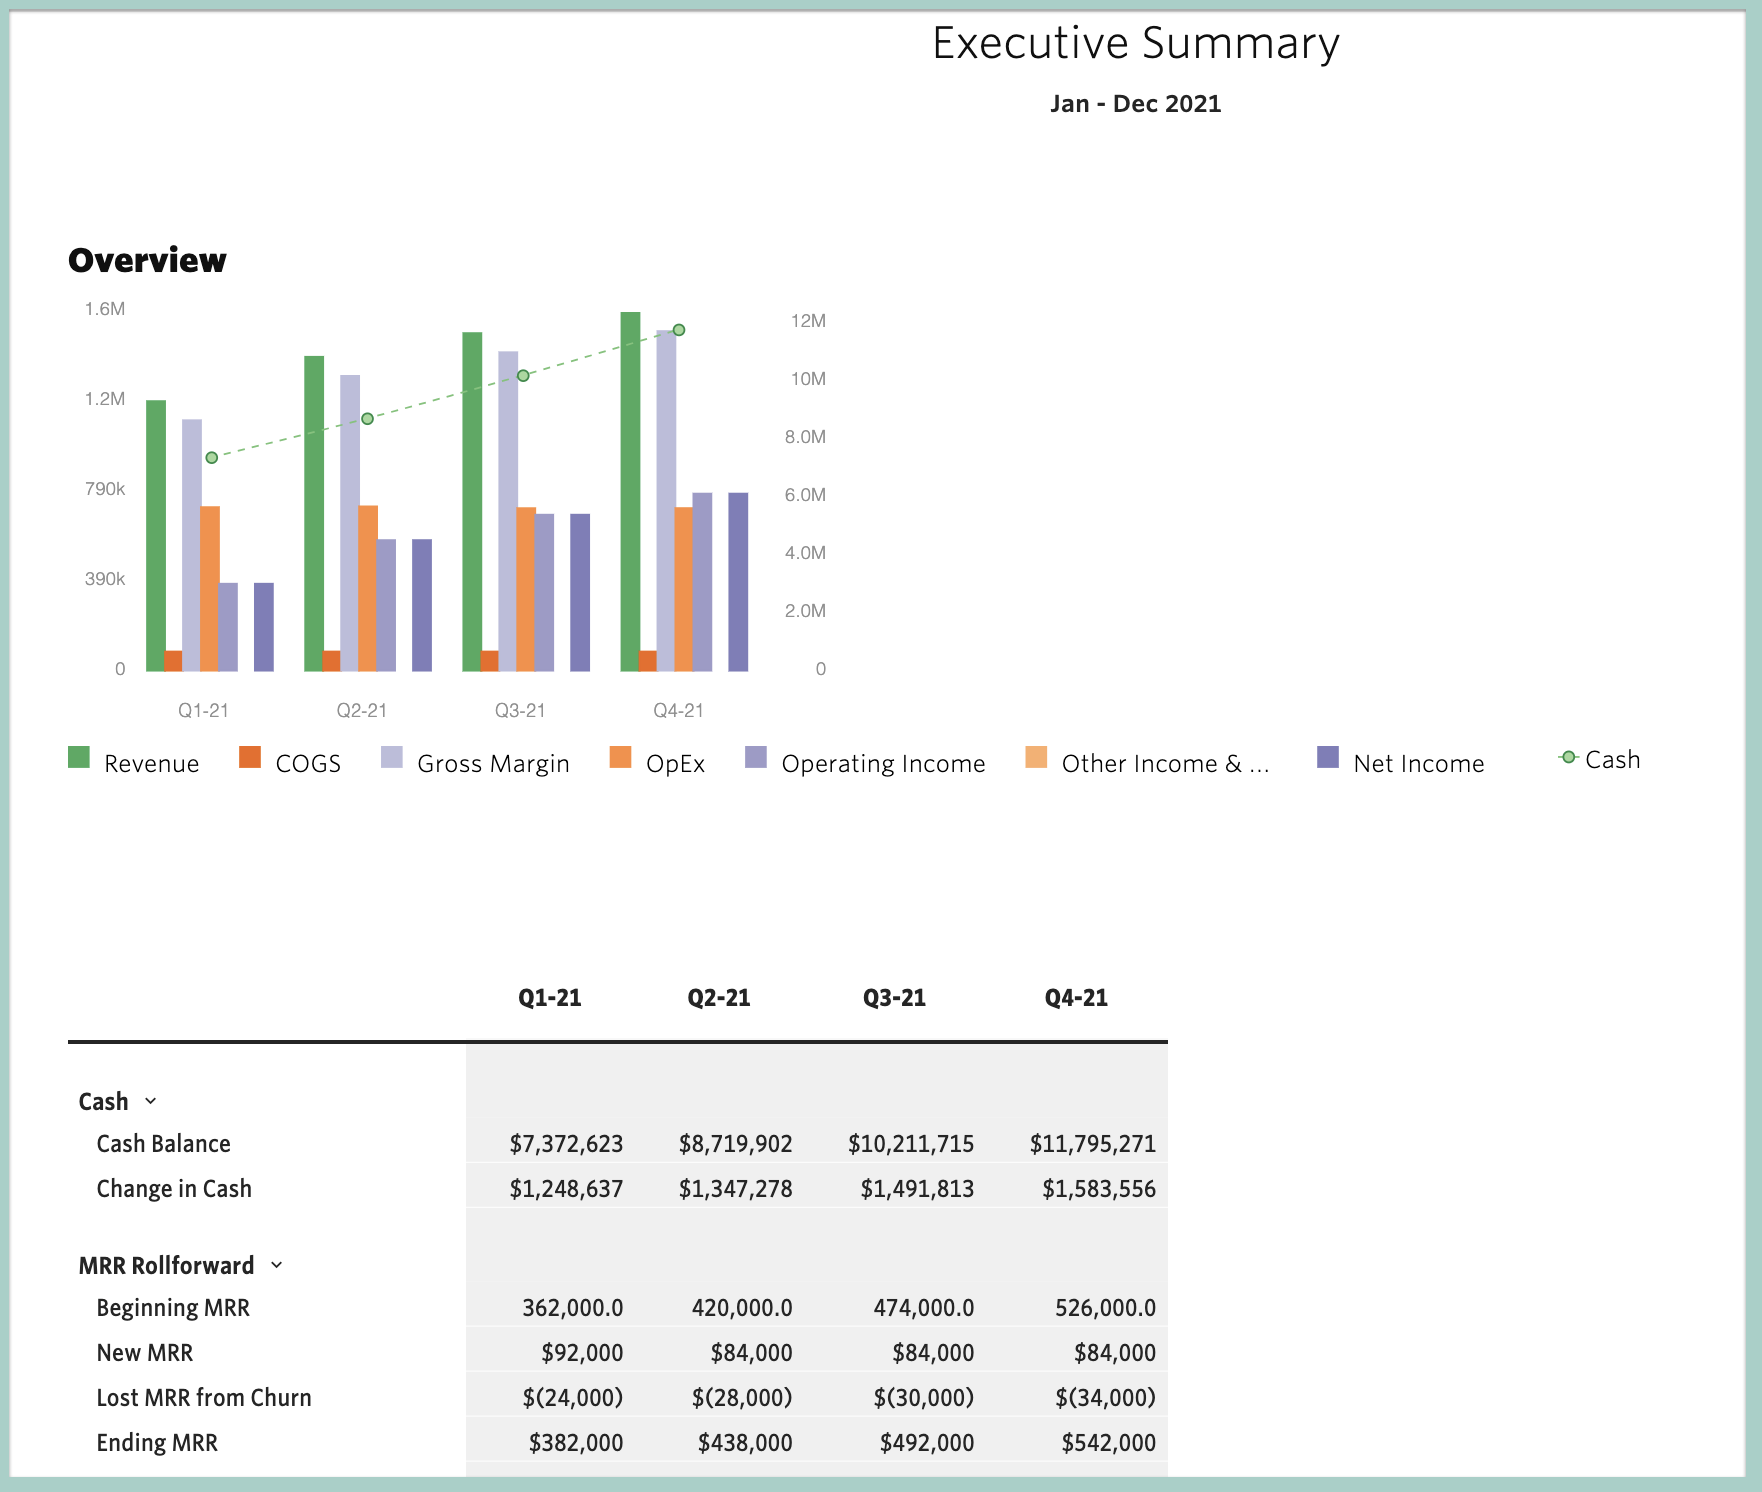
The Executive Summary defaults to display a summary graph, cash metrics, an Income Statement summary and headcount by department. This default data shows YTD Actuals for the current year by month. You may also wish to display additional key metrics for your business in addition to the cash position, for example the rollforward of monthly recurring revenue (MRR)*. Additionally, you may wish to display data from a different Source or time period. To update the Executive Summary report to display these additional metrics for the current plan by quarter, follow the steps below.
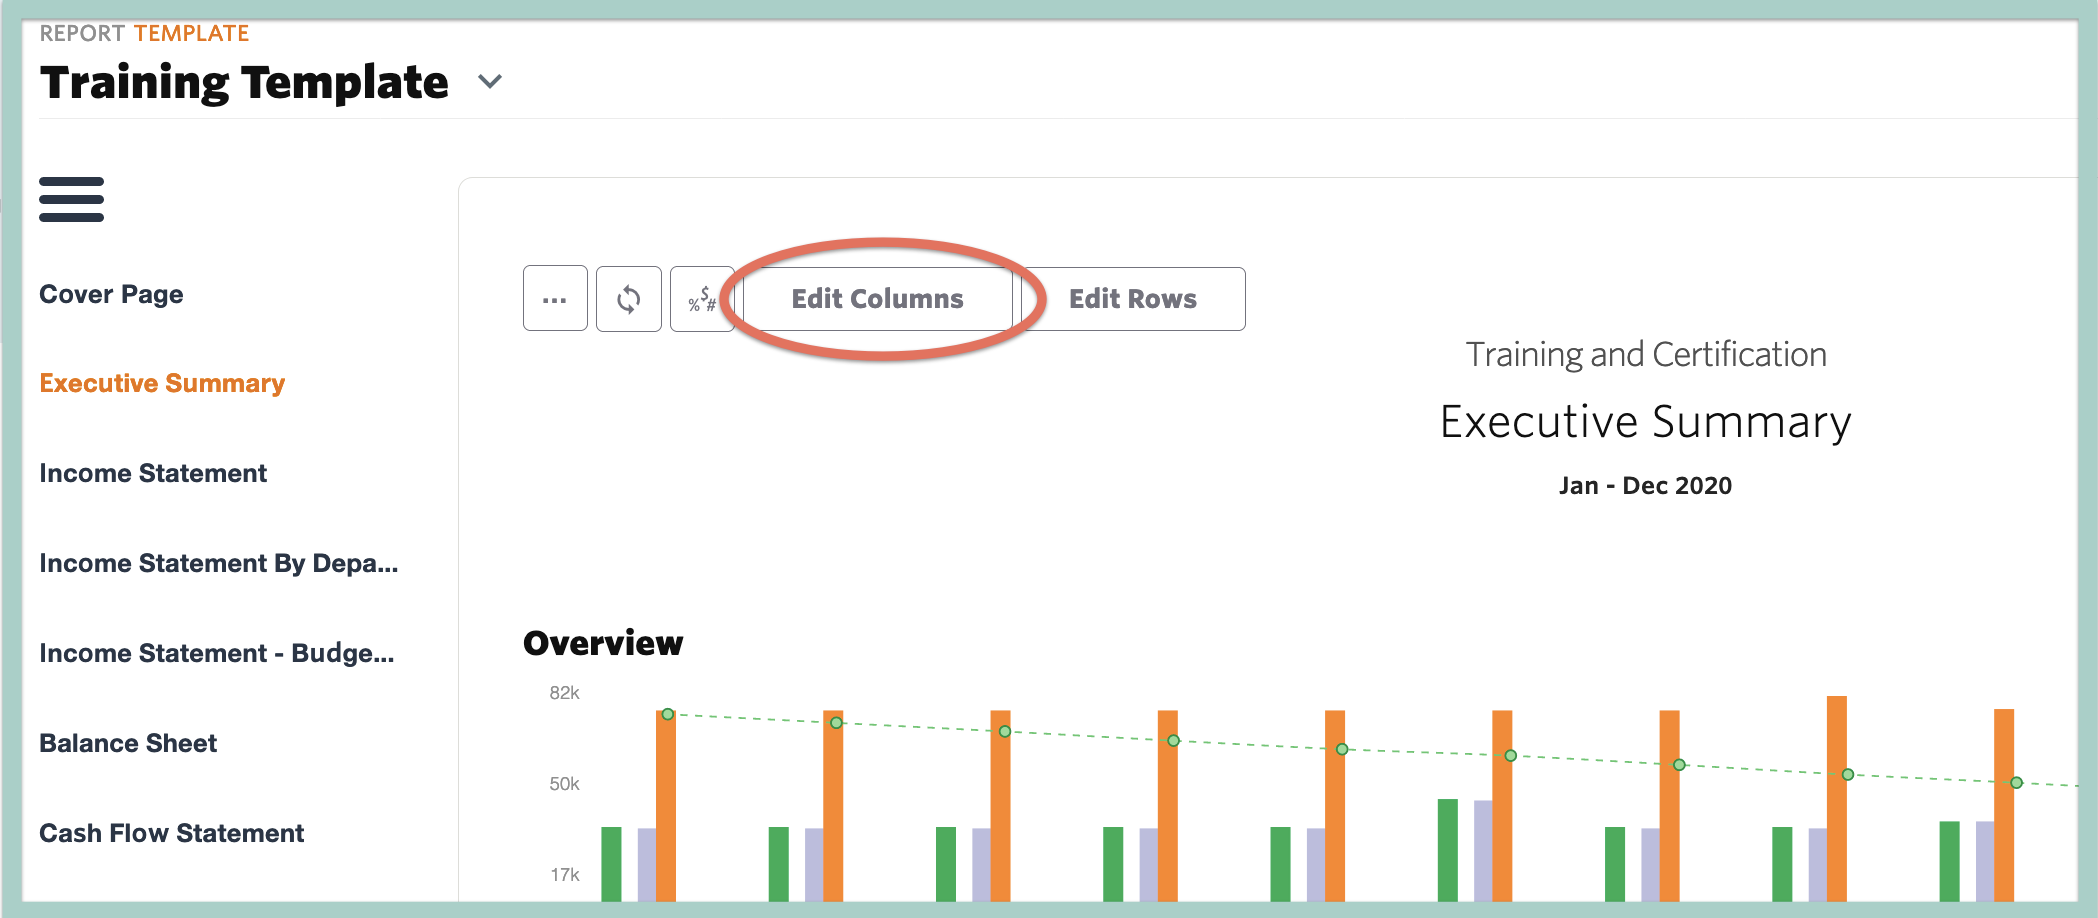
- Select the Executive Summary report from the Training Template
- Select Edit Columns
- Verify the Report Period is set to the time frame you'd like to report on, e.g., This Year
- Adjust the Report Columns to show the granularity you'd like to see for your analysis, e.g., Quarters
- Adjust the Column #1 Source to the current plan, e.g., Budget
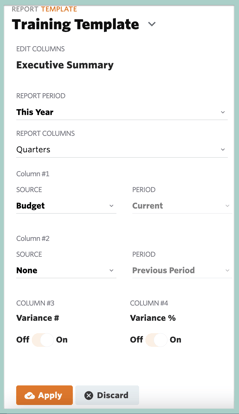
- Select Apply - the report should now show data for the plan by quarter
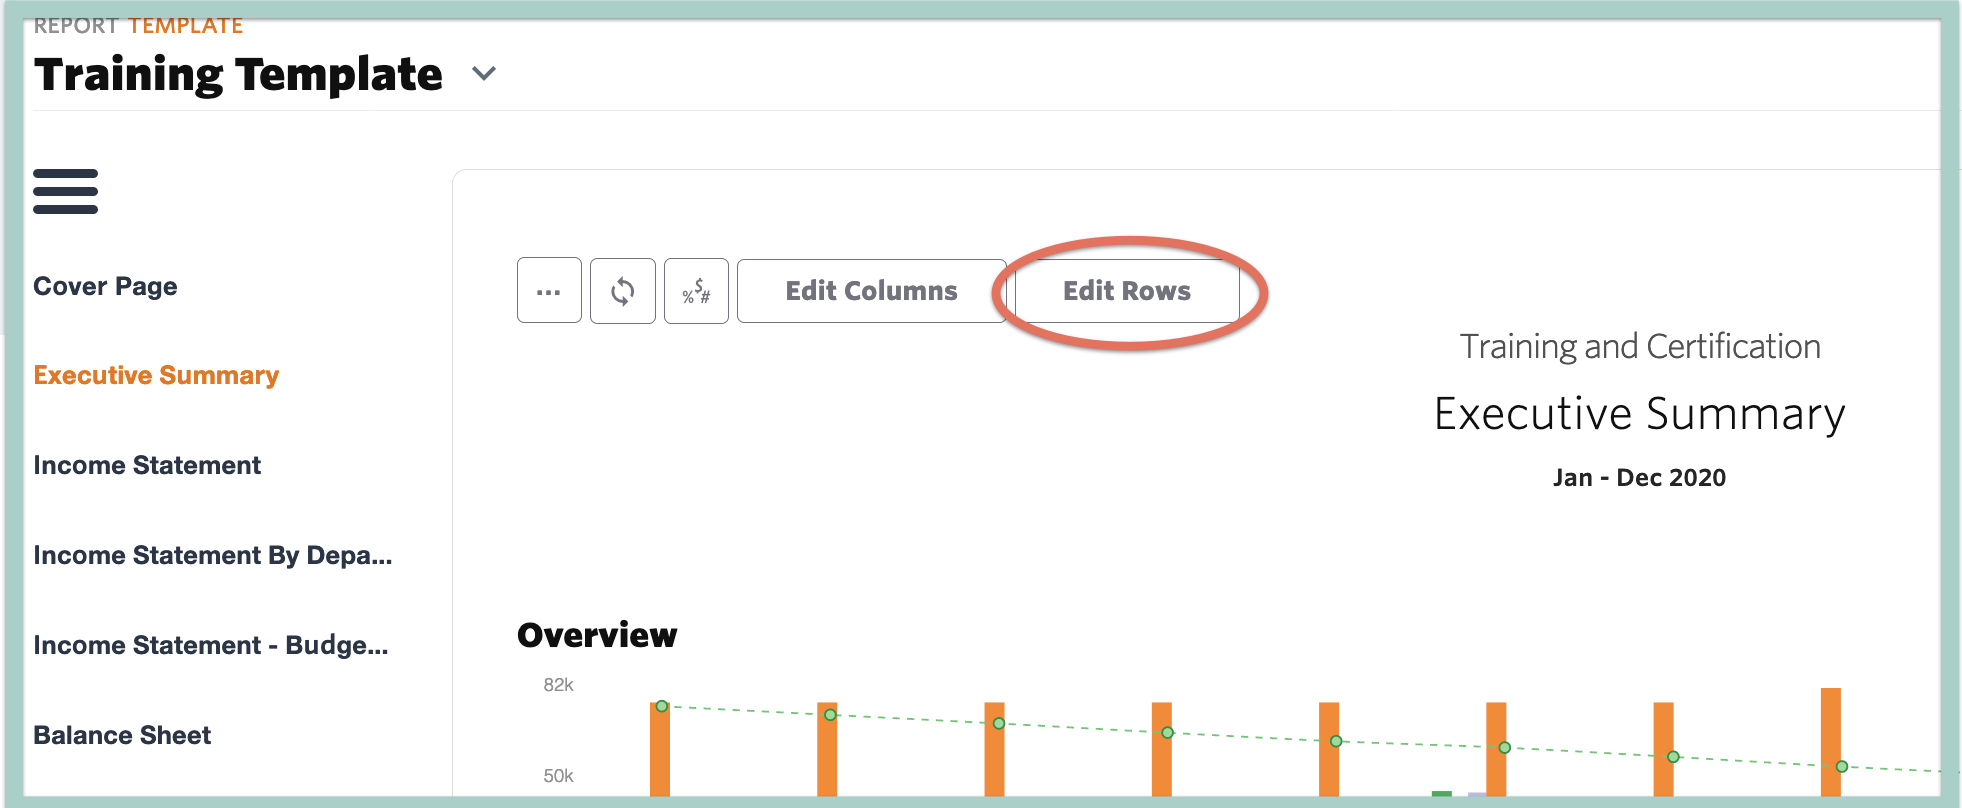
- Select Edit Rows
- Select + Add Section under the Cash section
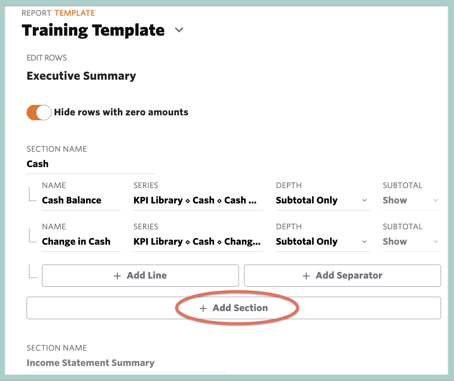
- Name the Section MRR Rollforward
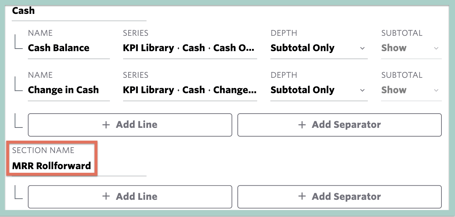
- Select + New Line in the MRR Rollforward section
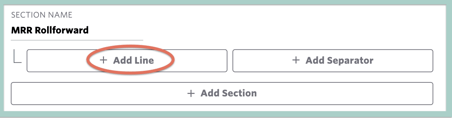
- Name the new line MRR Rollforward
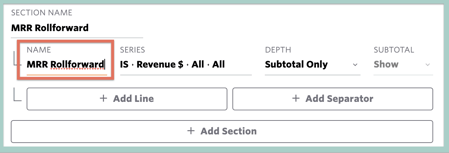
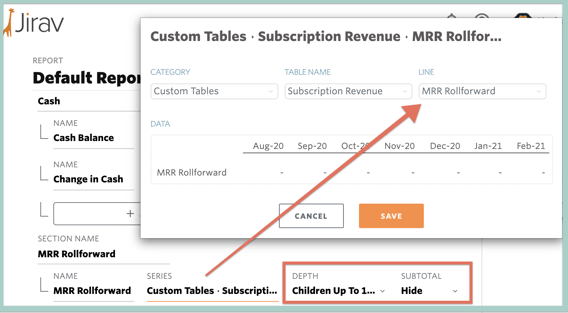
- Edit the Series by selecting IS - Revenue - All - All under to open the UA Picker, select MRR Rollforward from the Subscription Revenue Custom Table, set the Depth to Children up to 1st Level and the Subtotal to Hide and Save
- Select Apply
- Save Changes
Income Statement
No modifications required. The Income Statement report defaults to show the Income Statement YTD actuals for all departments for the current year by month.
Income Statement by Department
No modifications required. The Income Statement report defaults to show the Income Statement for current year actuals with columns breaking down the data by department.
Income Statement - Budget vs Actuals
The Income Statement report defaults to show a trended view of actuals, but you may also wish to show how the plan is performing against actuals. To update the Income Statement report to show Budget vs Actuals, follow these steps:
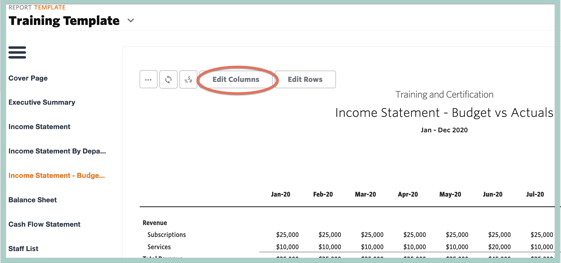
- Select the Income Statement - Budget vs Actuals report from the Training Template
- Select Edit Columns
- Verify the Report Period is set to the time frame you'd like to compare, e.g., This Year
- Adjust the Report Columns to show the granularity you'd like to see for your analysis, e.g., Year
- Adjust the Column #1 Source to the current plan, e.g., Budget
- Adjust the Column #2 Source to the actuals for the comparable period, e.g., Current
- Verify Variance # and Variance % are enabled
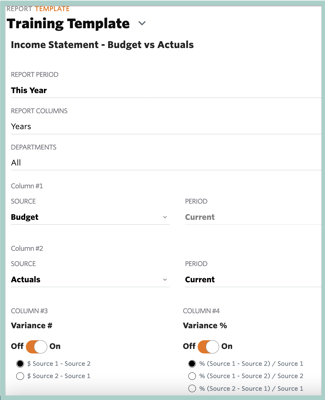
- Apply
- Save Changes
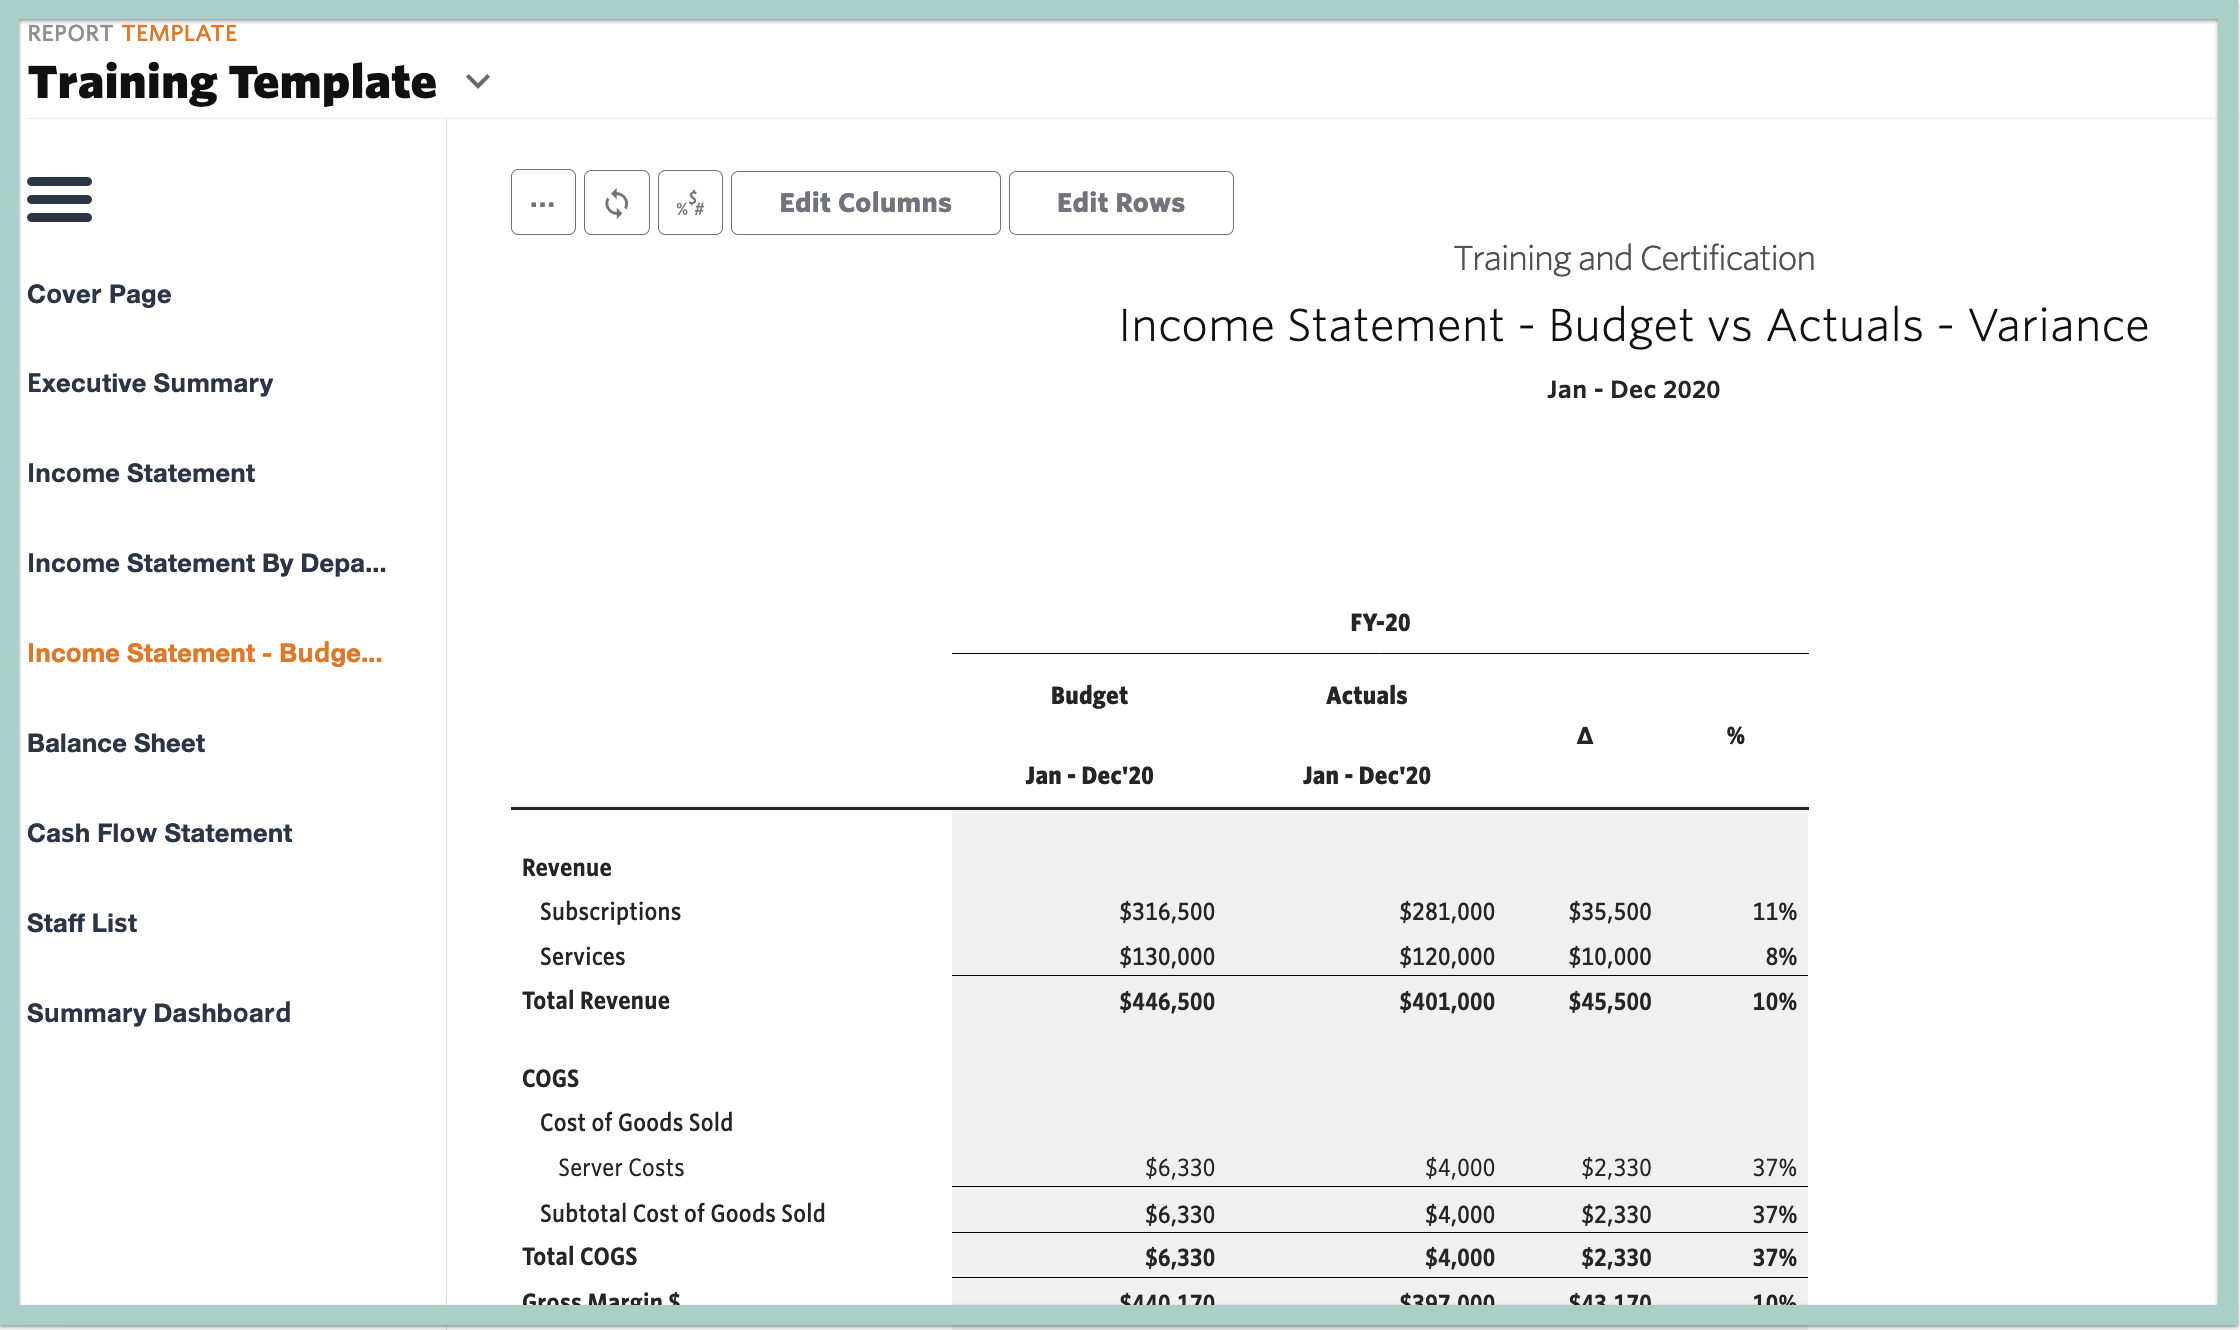
After completing this step, you should see the budget, actuals and a variance calculation between the two.
Balance Sheet
No modifications necessary. The Balance Sheet report defaults to show current year Balance Sheet actuals by month.
Cash Flow Statement
No modifications The Staff List report shows the roster of employees from the staffing module for the current year actuals. necessary. The Cash Flow Statement report defaults to show current year Cash Flow actuals by month.
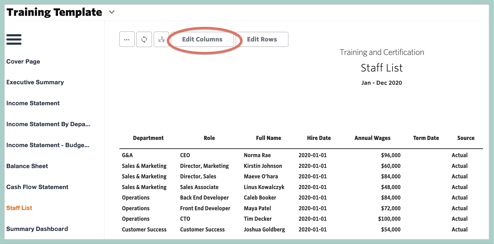
Staff List
The Staff List report defaults to show the roster of employees from the staffing module for the current year of actuals. For this report, you may also want to include planned hires. To update the report to show planned hires in addition to the current roster, follow these steps:
- Select the Staff List report from the Training Template
- Select Edit Columns
- Adjust the Report Period to the current plan year, e.g., Next Year
- Adjust the Source to the current plan, e.g., Budget
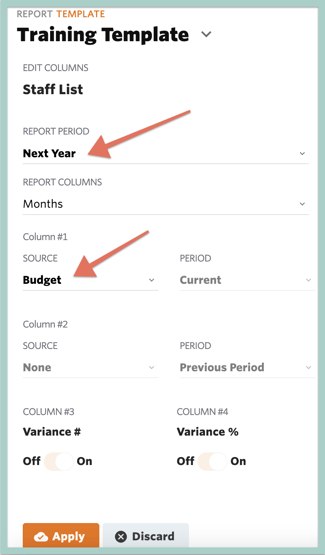
- Select Apply
- Select Save Changes
After completing this step, you should see that any planned hires will now appear in the report.
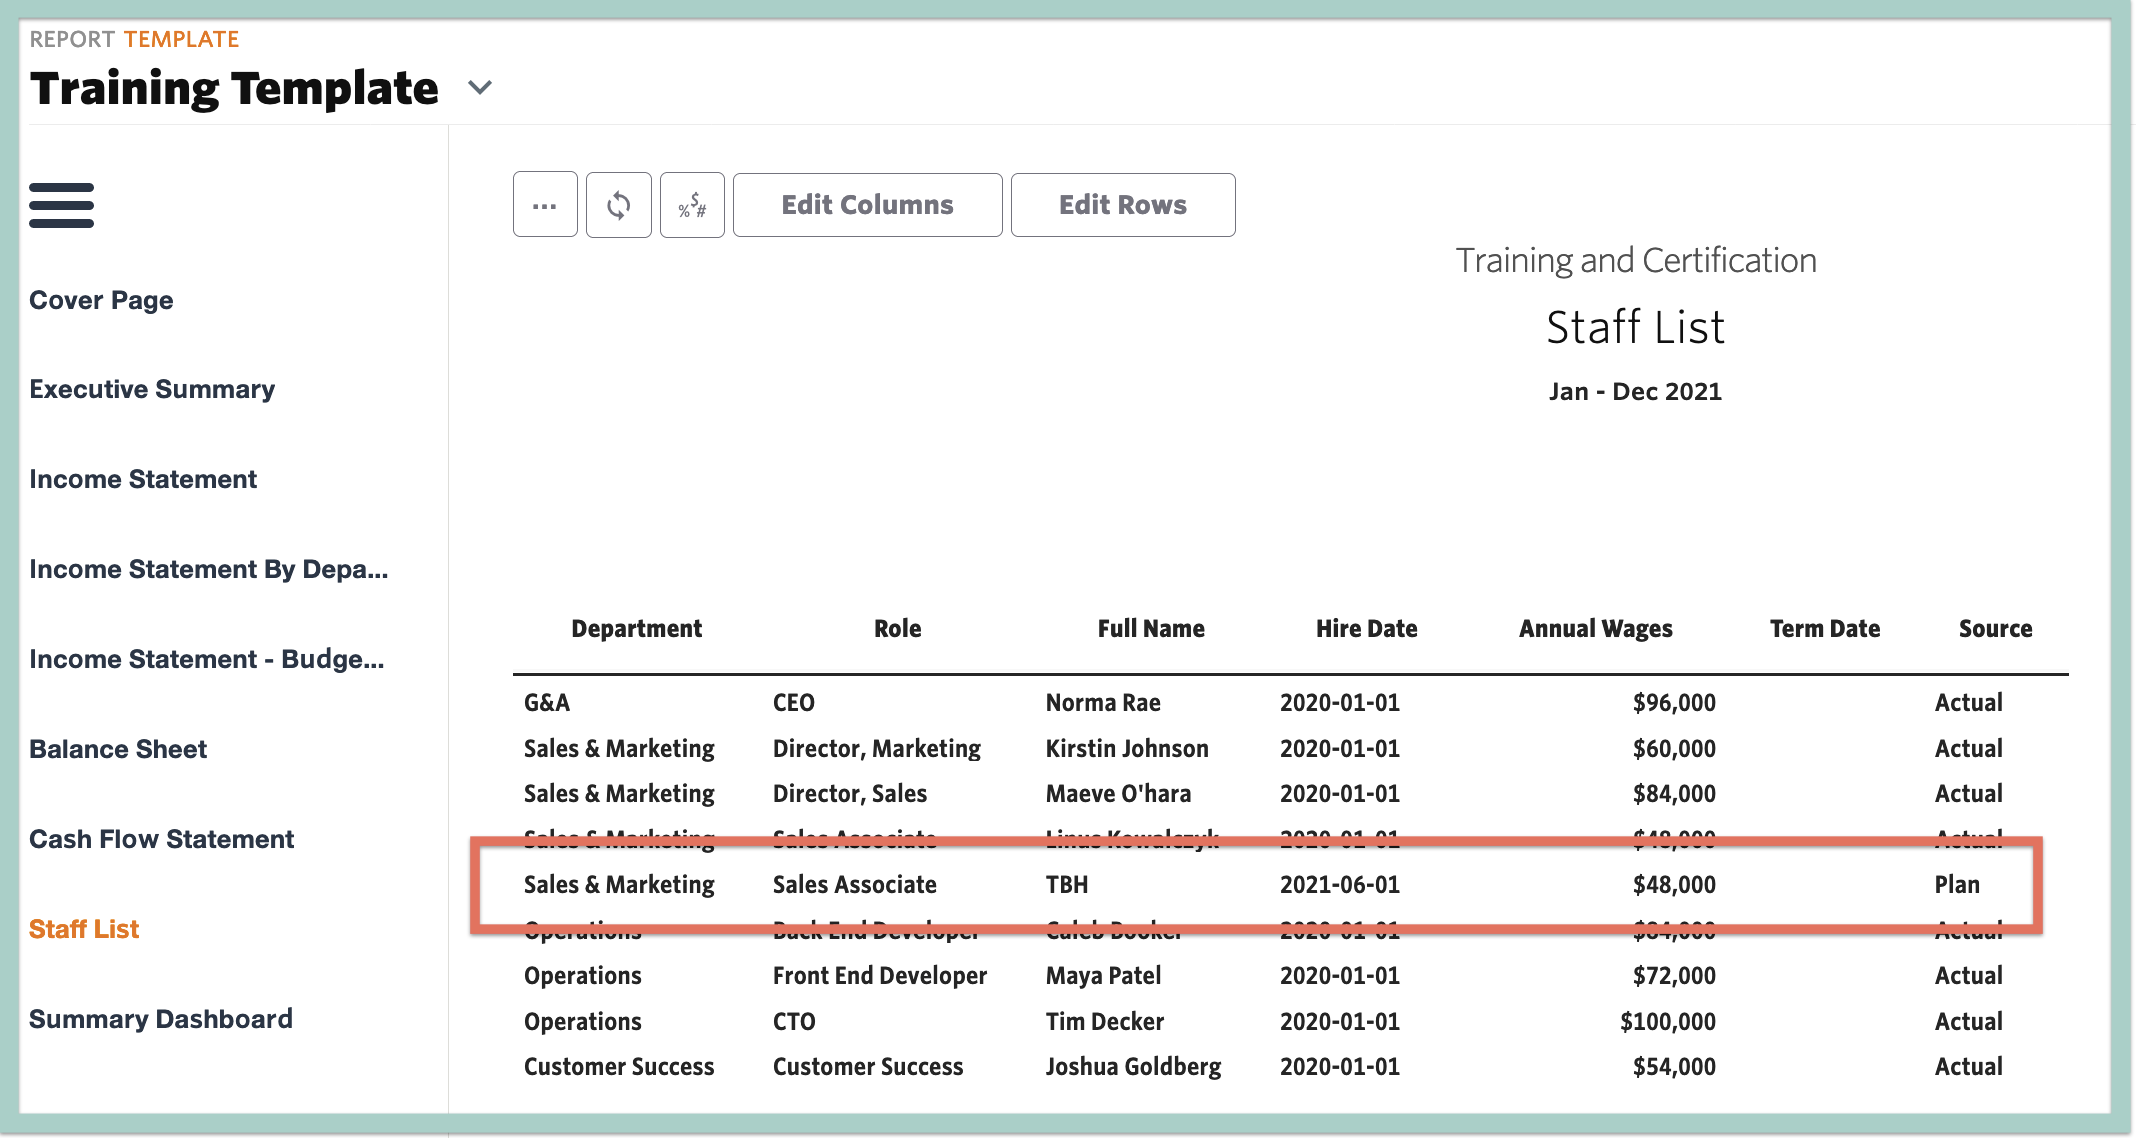
Note, for users with the Viewer: Dashboard & Reports Limited Role, the Salary column will be suppressed from their view of the Staff List report.
Summary Dashboard
No modifications necessary. This report is simply displaying the already configured Summary Dashboard from the Dashboards area of Jirav.
Publish a Report Template
Report templates are live. This means that as soon as the underlying actuals or plan data updates, the report template will simultaneously update as well. Publishing your template will produce a hard-coded copy of the report that can then be shared out to users as needed.
For example, if you have a month end report template, best practice would be to publish it monthly and distribute the published version to your key stakeholders.
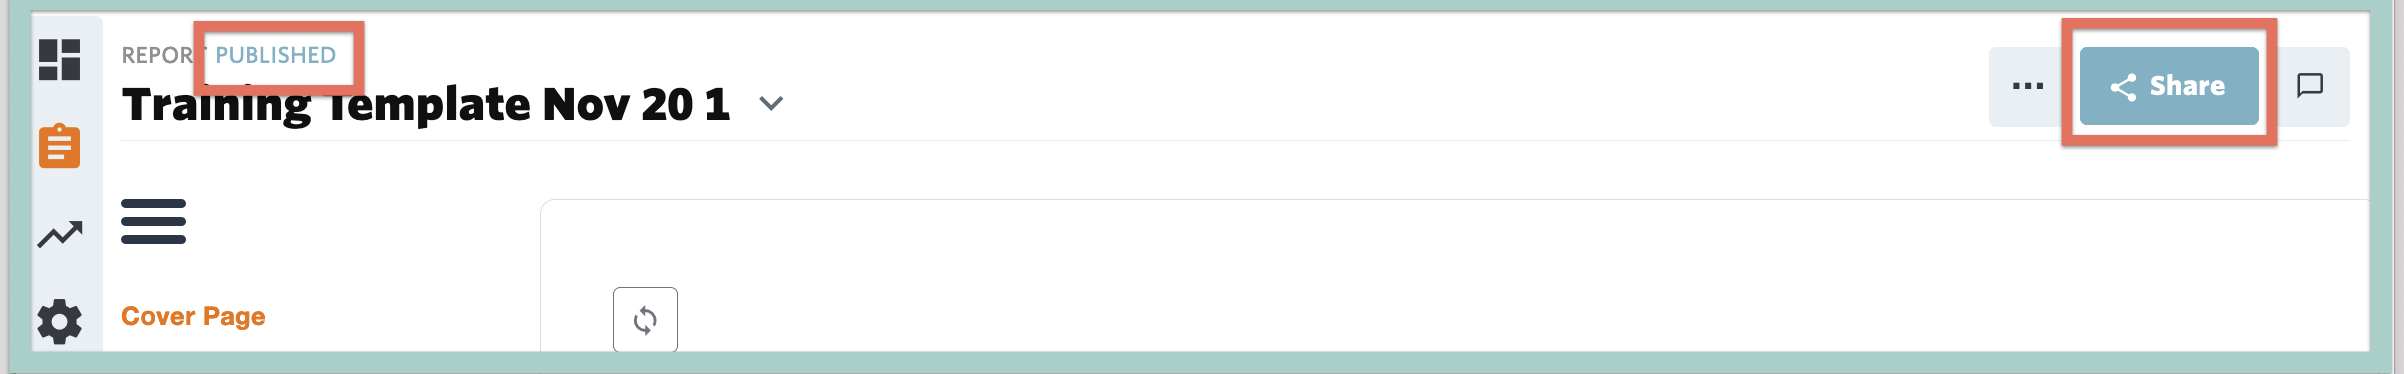
To publish a report, click the Publish button in the upper right-hand corner while viewing your template.
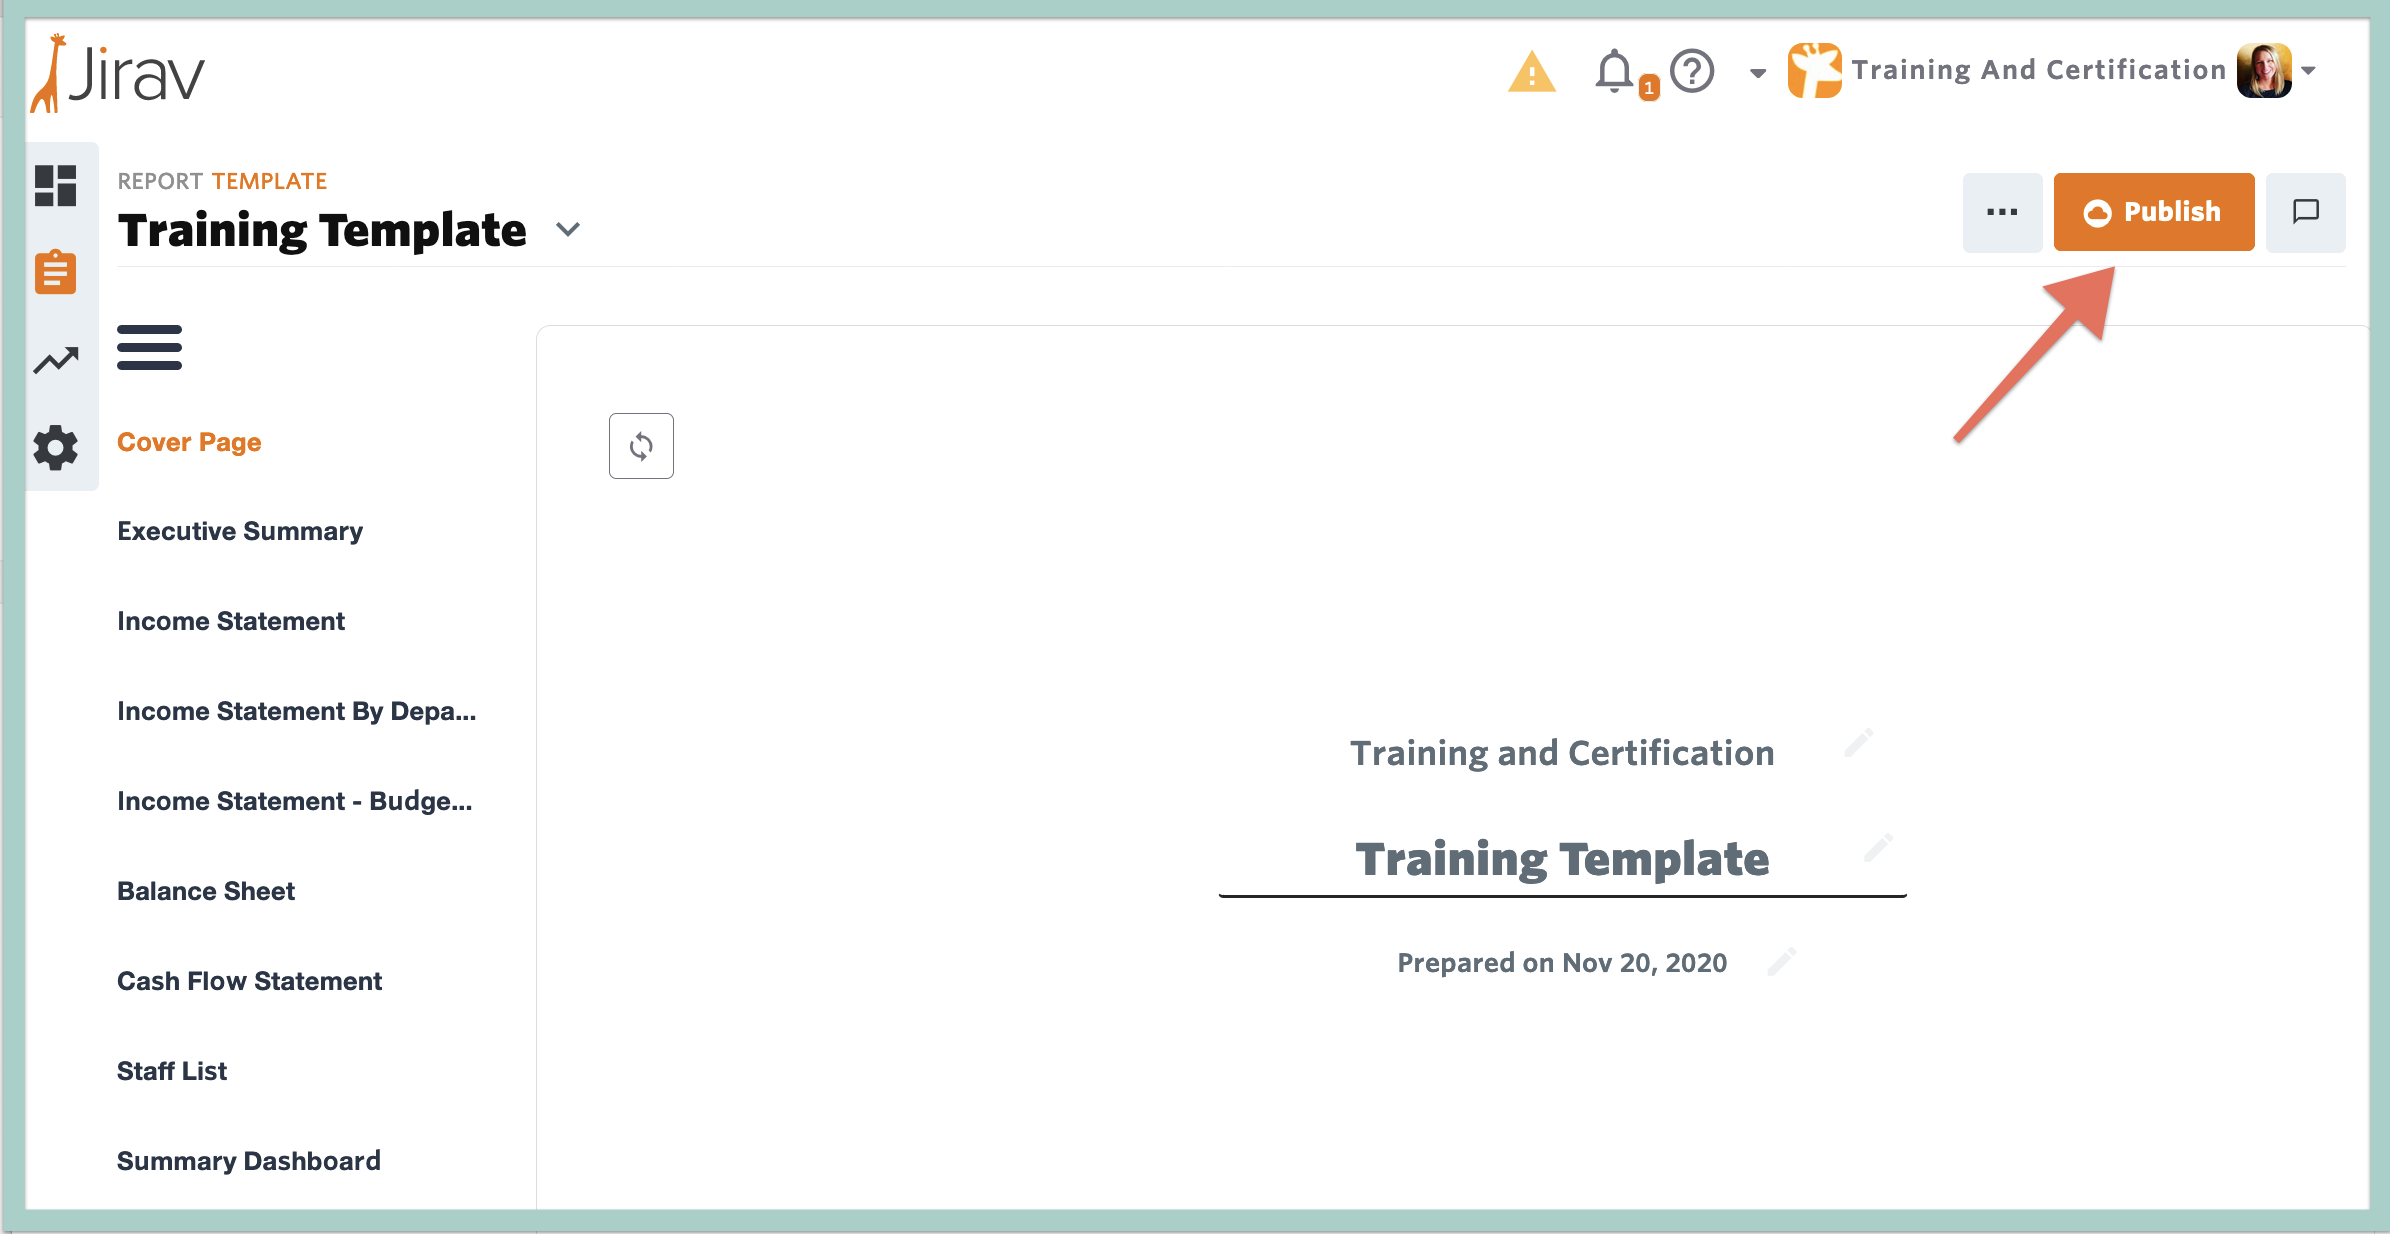
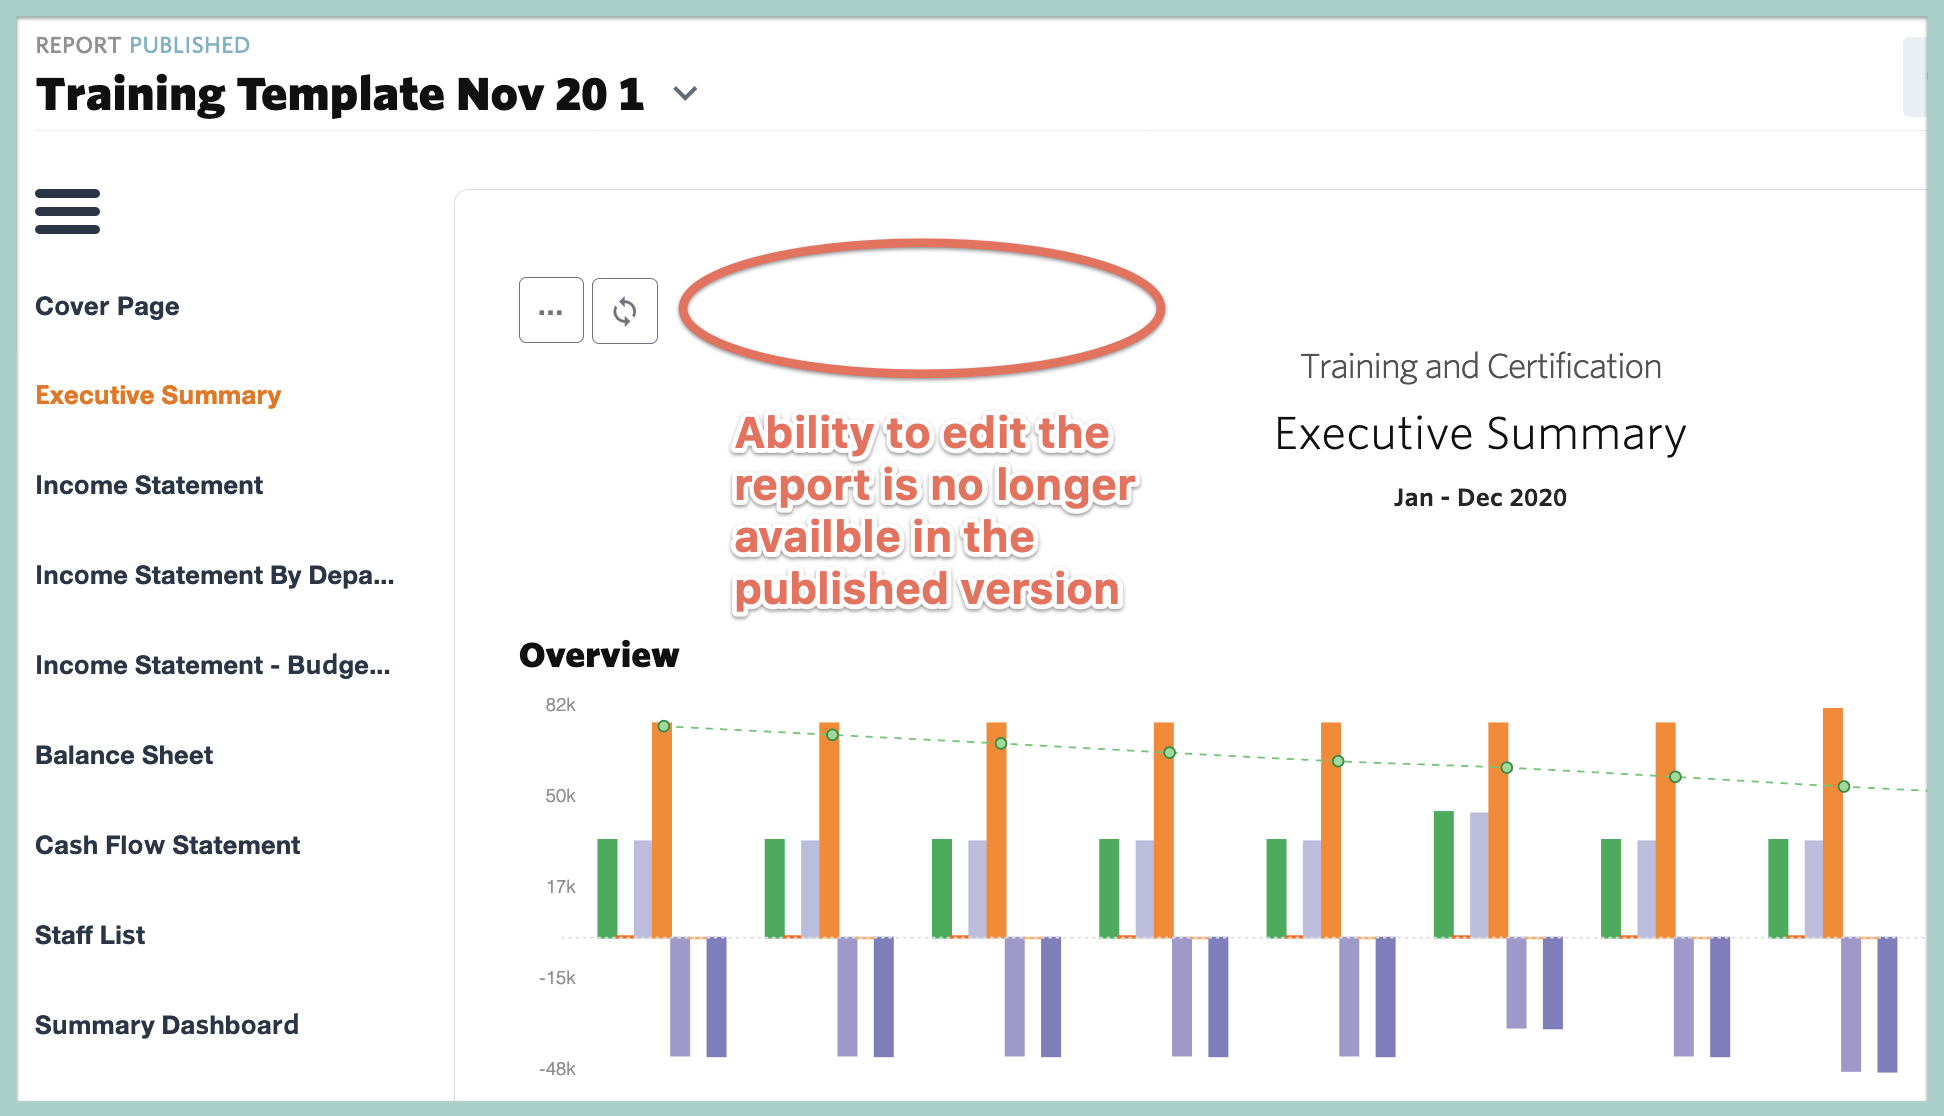
Upon publishing the report, you will be redirected to the published version of the report. A few things to note:
- The report will look exactly the same as it did in the template view, but you will no longer have the option to edit any of the reports in the template.
- Opening the report dropdown will show the original, live template remains available for use in future reporting periods. The newly published version of the report is shown in the published section.
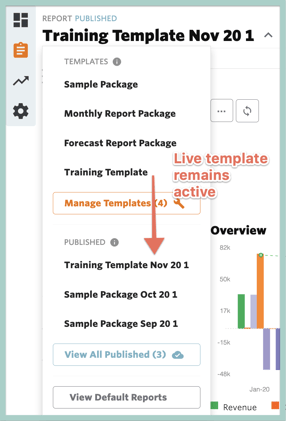
- The header above the report name shows it is Published and the Publish button is replaced by the Share button.
Share a Published Report
While you can share a template or a published report, we typically recommend sharing published reports to key stakeholders as a best practice so you can easily reference back to exactly what information you shared with them.
There are two ways you can share your published report, (1) through Jirav or (2) via export to Excel or PDF.
Sharing using Jirav
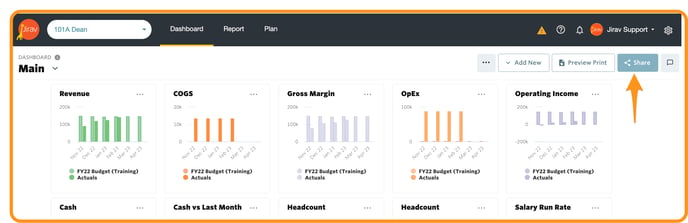
To share your published report via Jirav, verify you are viewing the desired Published report and then click the Share button in the upper-right hand corner of the screen.
You will then be prompted to share the published report template with individual users or groups of users with an optional message.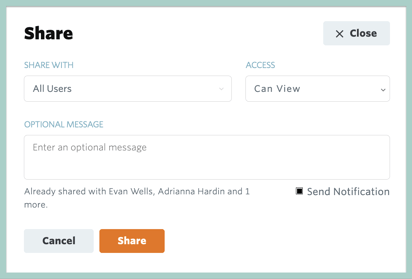
This action will send the user(s) selected an email inviting them to view the published report. Accessing the invitation via email will require the user to login to Jirav and they will only be able to see the data that you have explicitly shared with them.
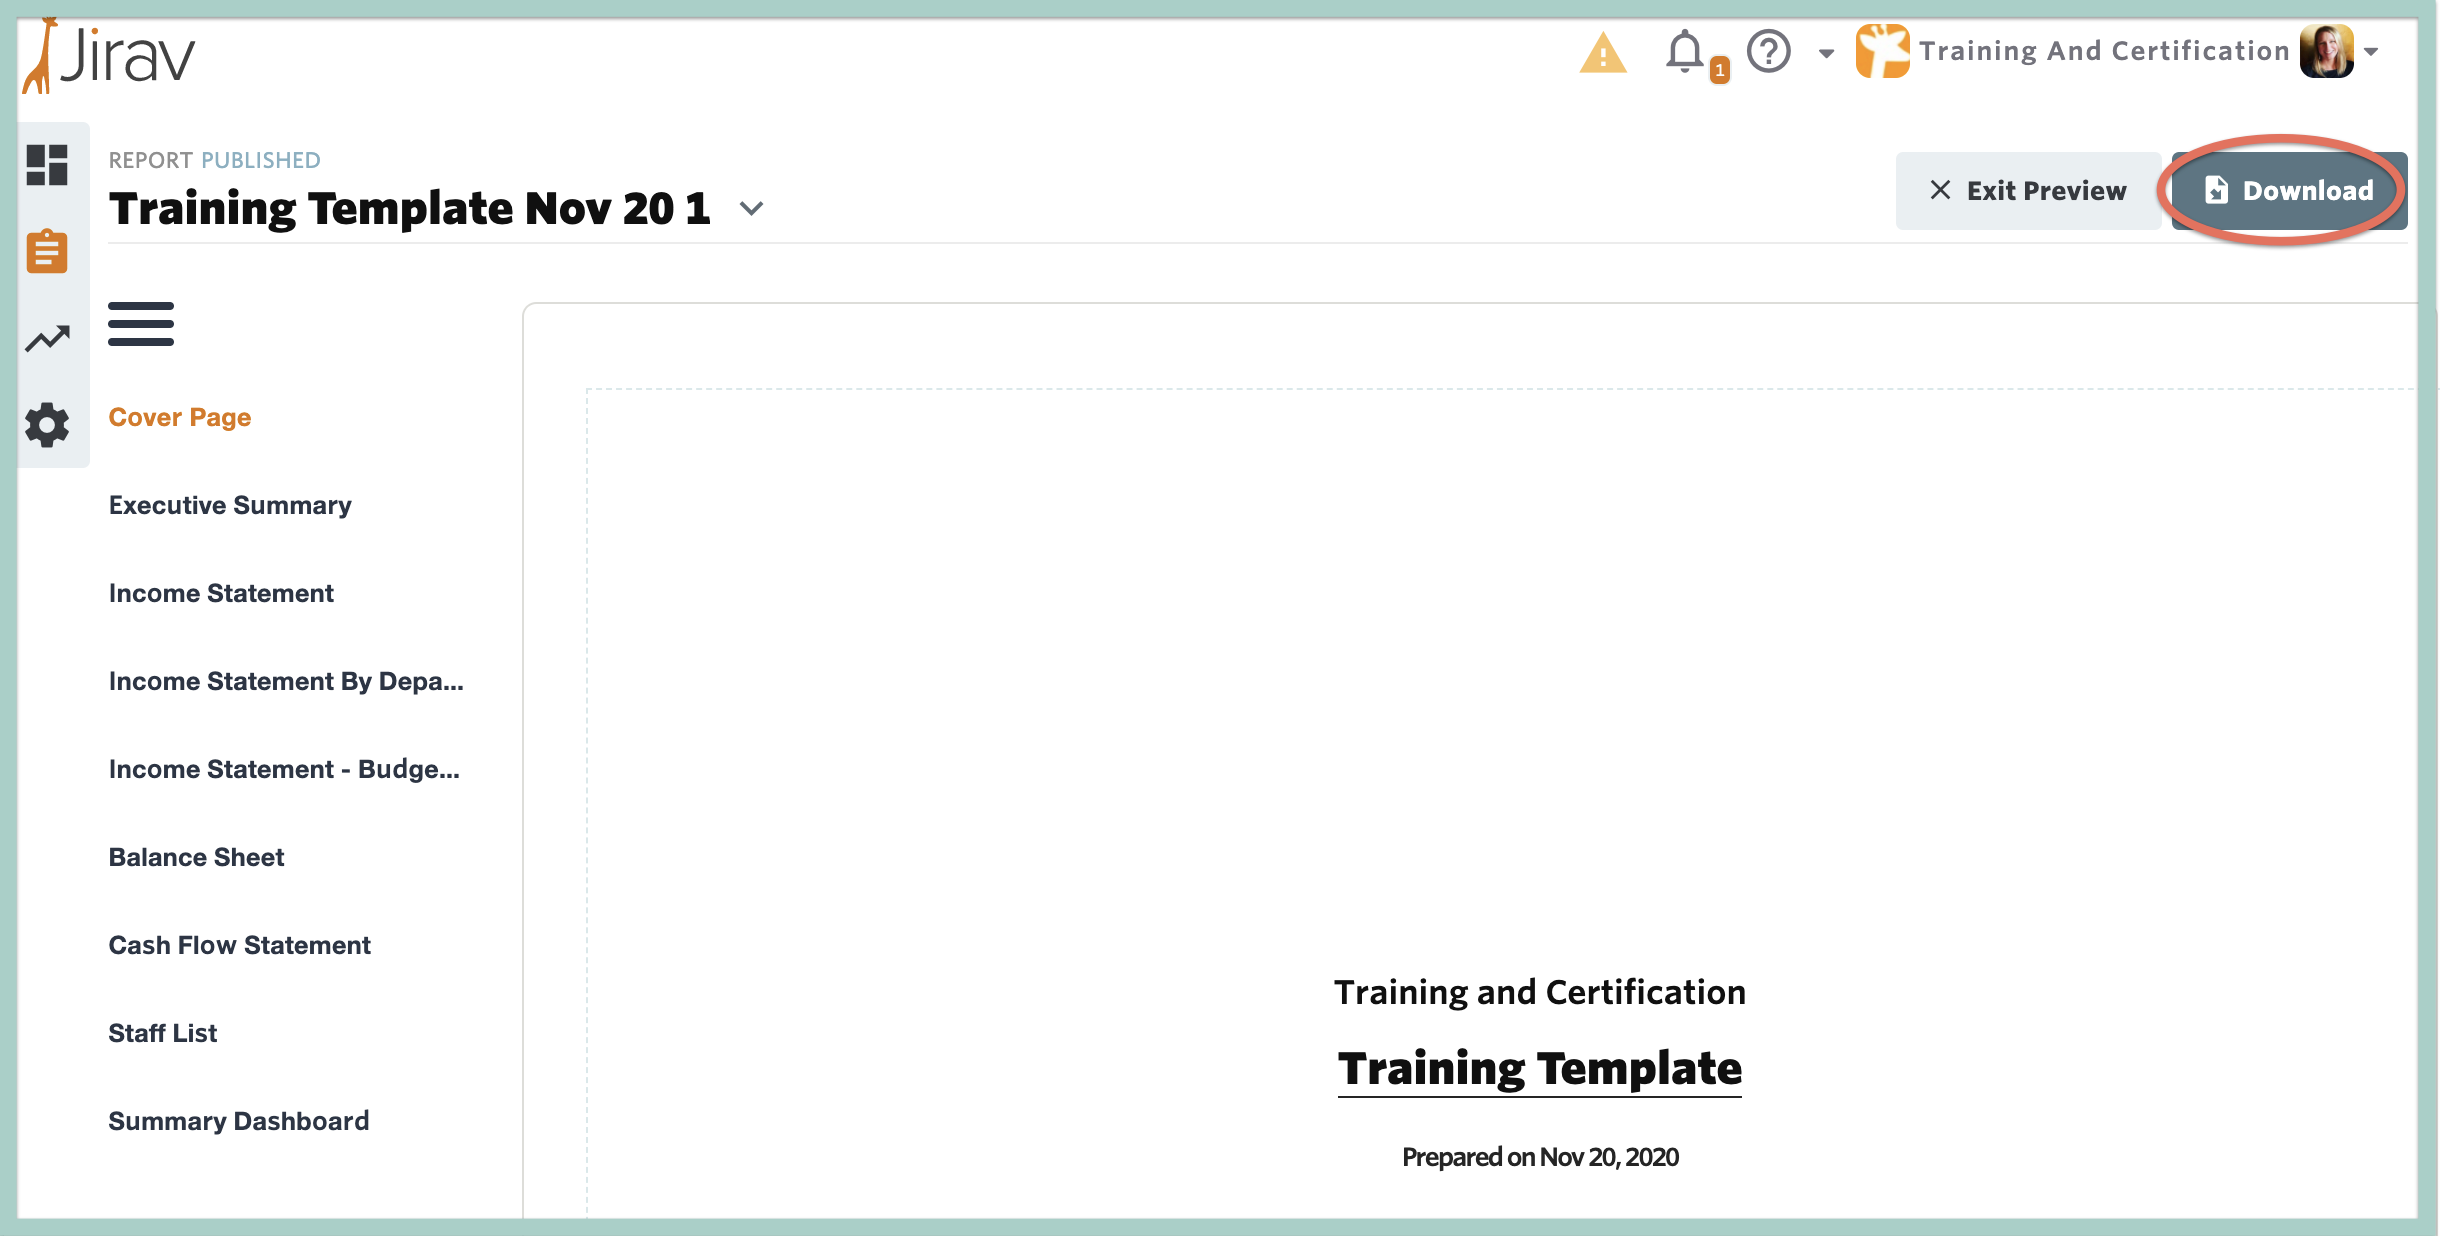
Sharing via Export
To share your published report outside of Jirav by exporting to PDF or Excel, verify you are viewing the desired Published report, select • • • in the upper-right hand corner of the screen to activate the context menu and then select Preview PDF or Export as Excel.
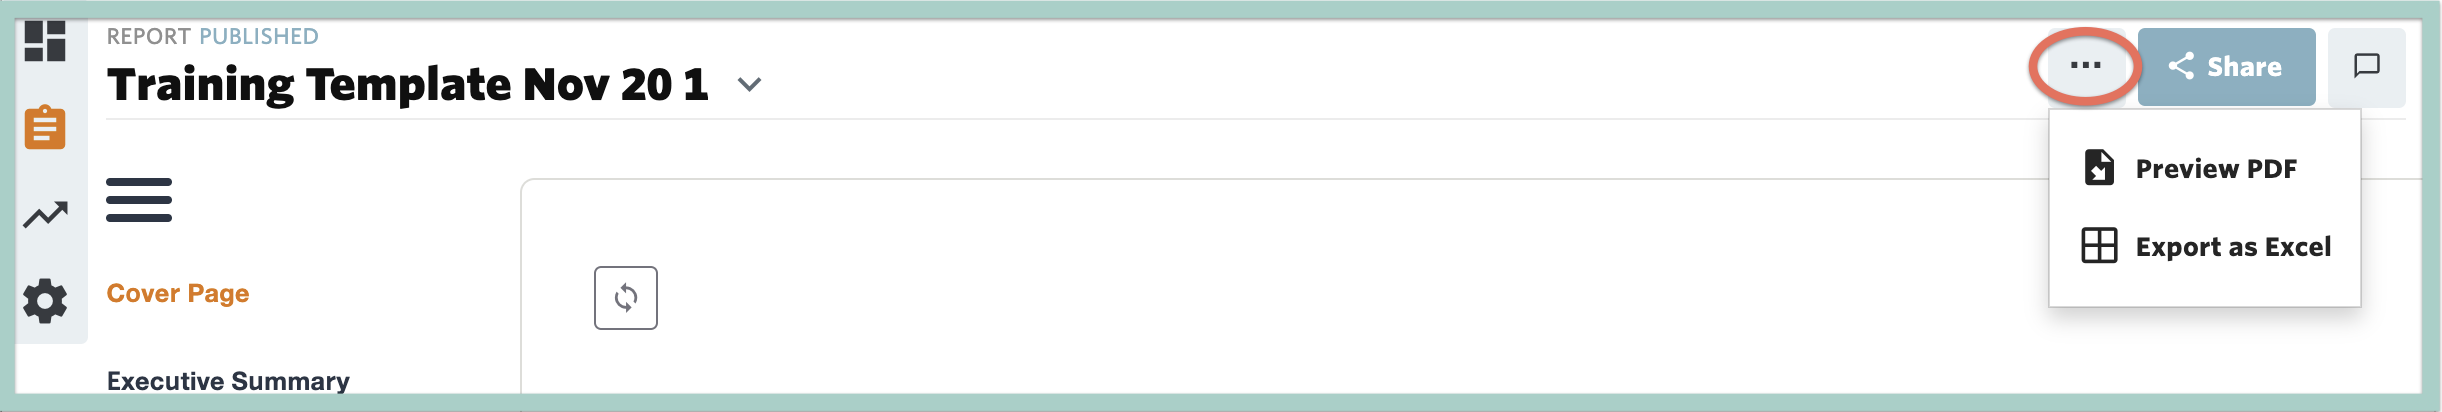
Preview PDF will generate a preview of the published report template in Jirav which you can then choose to download to PDF.
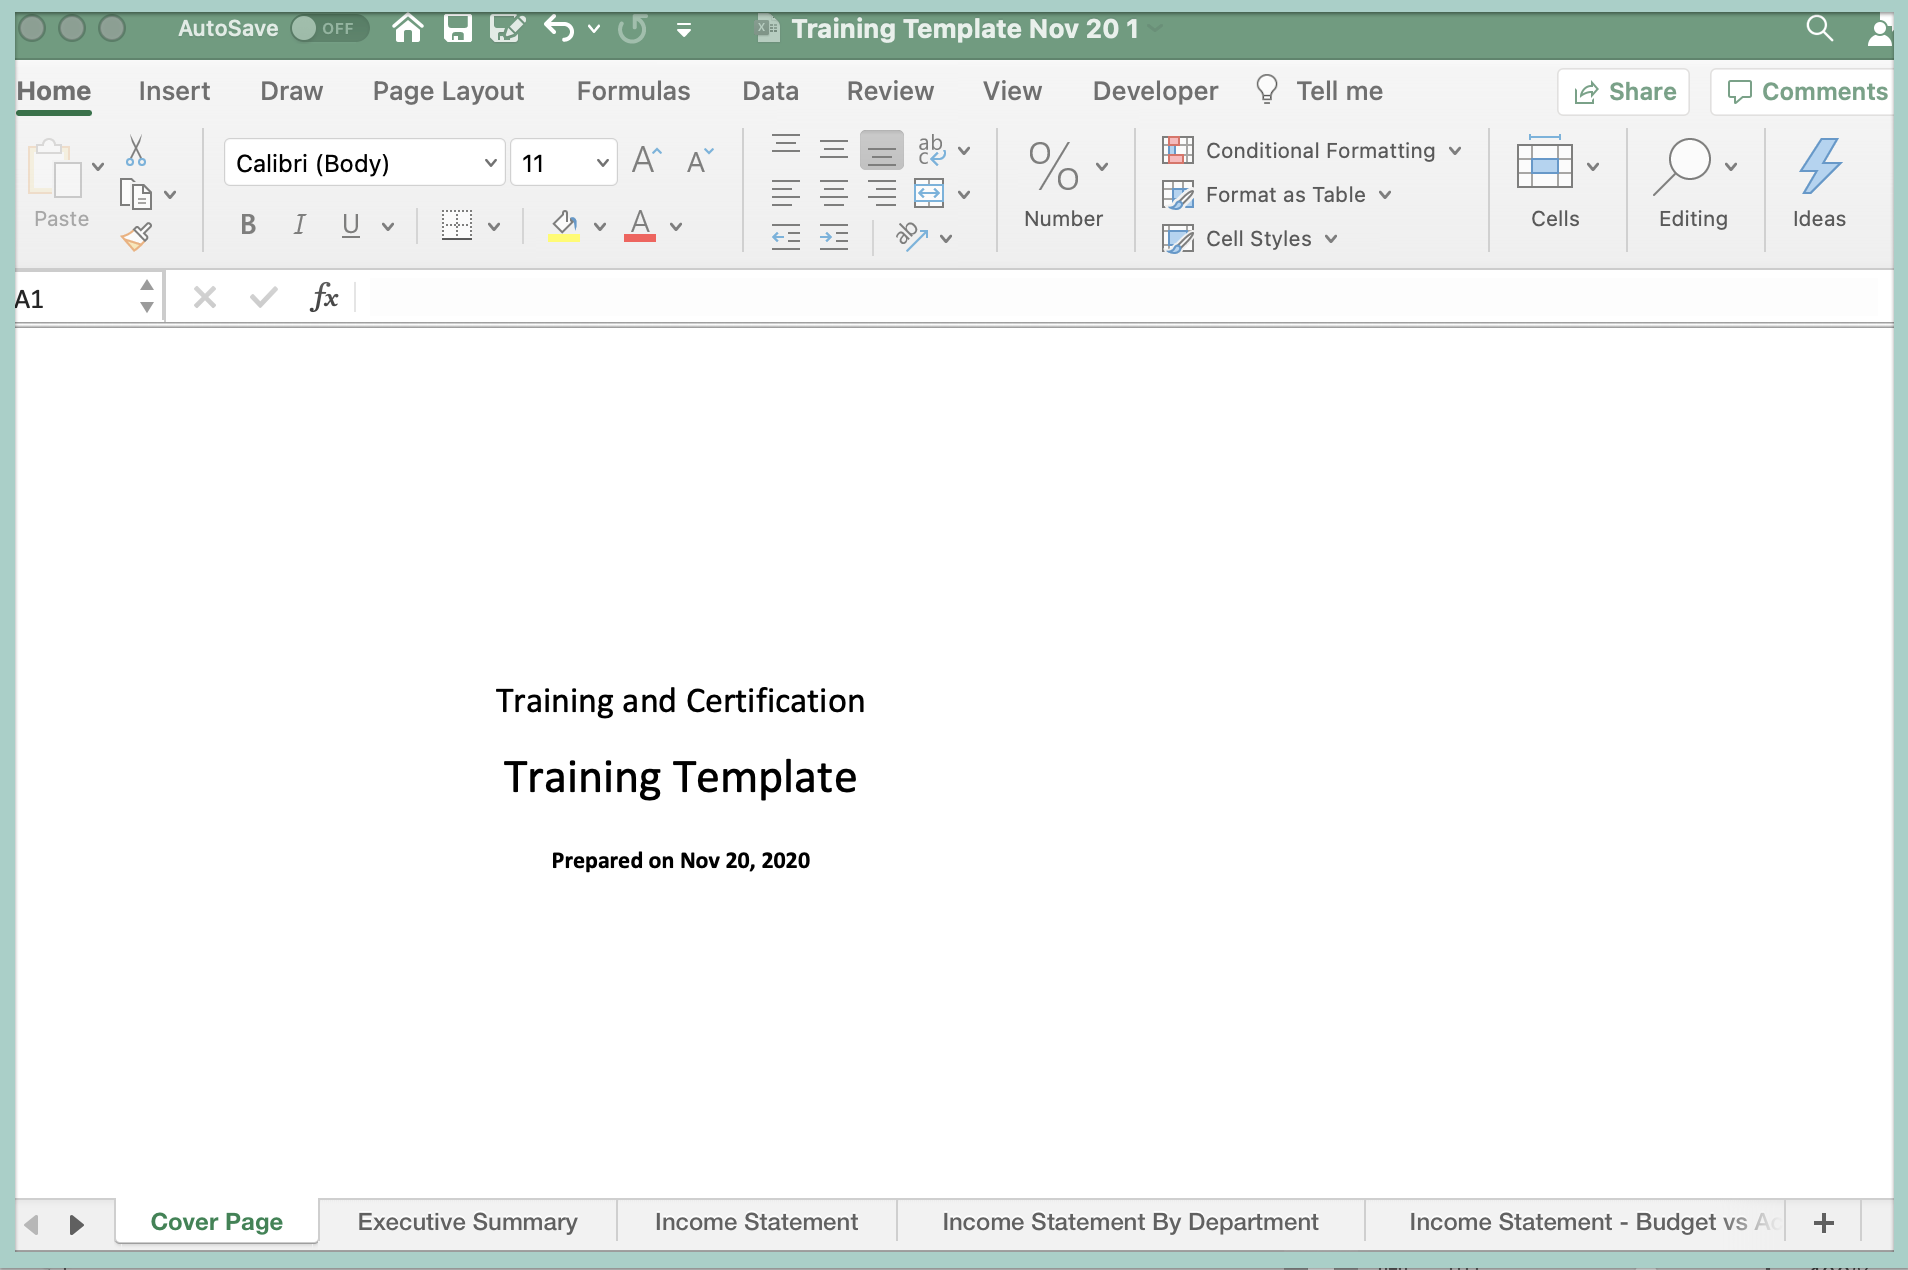
Export as Excel will export the published report template to Excel with a tab for each report.
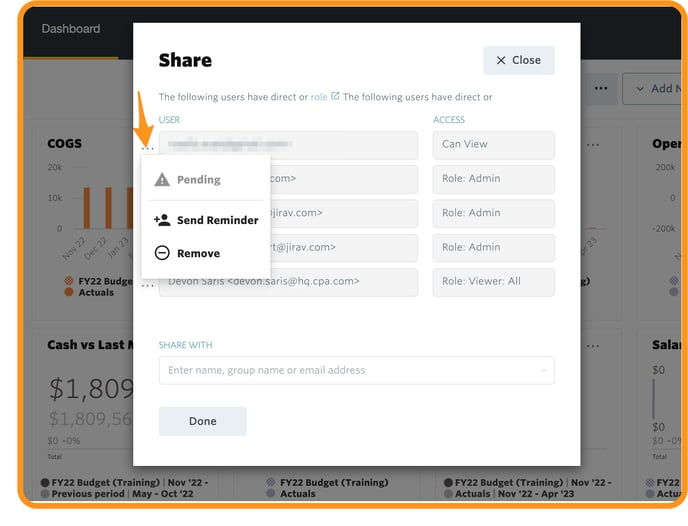
Unshare a Published Report
Begin by selecting the "Share" button"
You can then see who the Dashboard or Report has been shared with:
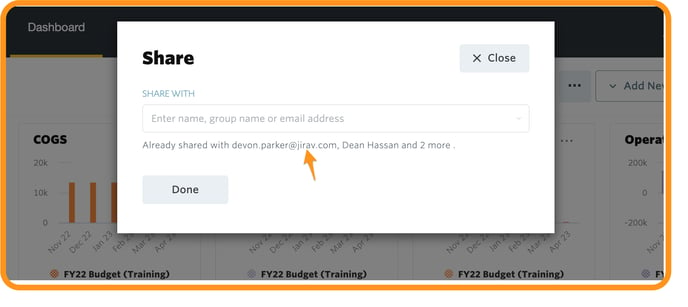
Click on the names listed and the following pop up will appear and you can then either Manage the users, send a reminder, or remove a user that is only Basic type user:
Additional Resources: Reports & Dashboards Video