Leverage Jirav's Auto Forecast to streamline your planning process by harnessing automated intelligent algorithms. This feature not only examines prior trends, accounting for increases and decreases over extended periods, but also incorporates seasonality, predicting fluctuations based on different periods within a year. Additionally, the Auto Forecast removes outlier events, ensuring a more accurate and reliable starting point for your business planning journey. You retain the flexibility to fine-tune the forecast or opt not to use it according to your specific needs.
To activate the Auto Forecast feature, go to the Plans section and access the Auto-Forecast settings by clicking on the option from the right rail menu.
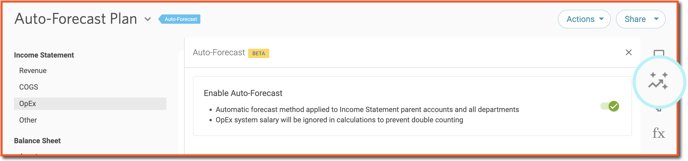
In plans where Auto-Forecast is enabled, the forecast calculations will be performed at the first child account level for all Income Statement accounts. At this level, you have the option to manually adjust the auto-forecast if needed. It's important to note that system salaries are not calculated based on staffing in Auto Forecast plans. This deliberate exclusion prevents the possibility of double counting salaries.
Additional settings for Auto-Forecast can be found in Settings (⚙️) > Forecast > Auto-Forecast.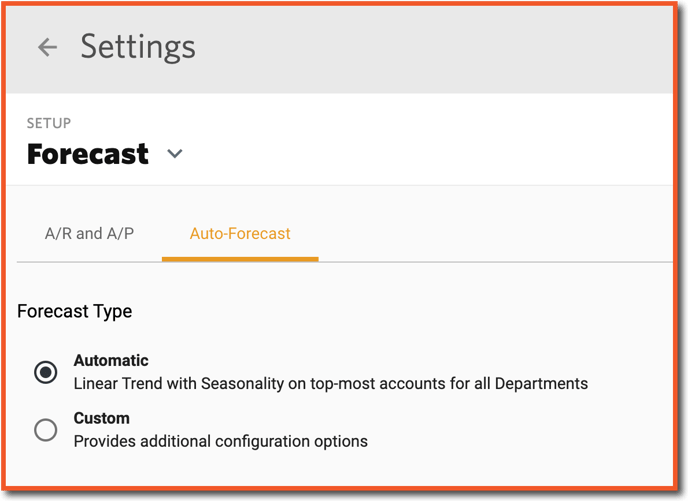
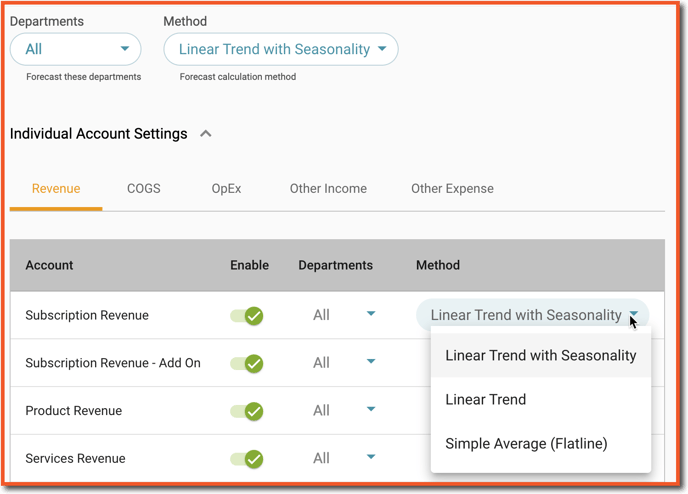
Selecting Custom provides additional options to customize the Auto-Forecast. Note, these settings only apply to plans where Auto-Forecast is enabled. The Simple Average (Flatline) option computes a 12 month average.
For Accounts where Auto-Forecast is not enabled, there is an option to add Drivers or manual inputs for the Forecasted period, as presented in the example screenshot below:

How Does it Work?
Jirav utilizes an advanced forecasting model that adapts to the quantity and quality of your historical data. Our system independently forecasts for each account and department, allowing you to view and utilize both the detailed data at the account/department level and the overall totals across departments and accounts in the application.
The most straightforward forecasting scenario occurs when there is an abundance of well-populated historical data for each account/department combination. In this case, we analyze the actual data to determine both the trend and seasonality, and then provide a forecast that incorporates both factors.
Trend
We calculate a weighted linear trend by analyzing complete 12-month periods. We take into account as much historical data as possible, giving more weight to the most recent data compared to older data. This means that changes from year to year will have a greater impact on the trend projection than changes from year 3 to year 2.
Seasonality
We analyze the historical data for annual and quarterly patterns. If these patterns exist and remain consistent over time, we calculate a seasonal projection. The strength of the patterns found in the actual data influences the moderation of this projection. When the actual data is highly correlated, we have more confidence in our seasonal projection. Conversely, for weakly correlated actuals, the amplitude of our projection is gradually reduced.
Outliers
In many cases, the actual data we have is not perfect. It may include year end audit adjustments, months with missing data, or other one-time business factors that can affect the accuracy of applying a simple trend. We identify these outliers in the data, which are statistically unlikely or follow a known outlier pattern, and handle them differently from the rest of the data.
Rather than dismissing the outliers completely, we take steps to minimize their impact in the forecast calculations. The treatment of outliers depends on where they occur in the forecast calculations.
For example, let's say your December sales are 10 times higher than the average (maybe because you sell holiday cards). Statistically, this may be considered an outlier. However, if this pattern repeats year after year, we understand that it's a characteristic of your business and will incorporate it into the forecast accordingly. On the other hand, if there is a significant spike in sales volume that occurs only once or unpredictably throughout the season, we will handle it differently.
Adaptive behavior
Auto forecast determines whether to incorporate trend and seasonality projections based on the available data and its quality. The more data we have, and the better its quality, the more intelligent and accurate the forecast will be.
If we have a sufficient amount of well-populated data, we will attempt to project both the trend and seasonality and include them in our forecast. However, we won't make assumptions or fabricate data. For example, if your actual data is noisy or unpredictable, with poor expression of seasonality, we won't adjust our forecast to match that unpredictability. Instead, you will see a straight line representing the trend. We only factor in a robust seasonality when we clearly identify it in the data.
User control
As a user, you have the power to control how much intelligence the forecast algorithm uses. You can choose to exclude the computation of seasonality, or both seasonality and trend, for specific accounts or departments. This option is particularly useful when dealing with accounts or departments that have extremely noisy, unpredictable, or sparse data. By exercising this control, you can ensure that the forecast algorithm aligns with your specific needs and requirements.
How much actual data do we need for forecasting?
For our auto forecast module to provide accurate predictions, it is necessary to have a minimum of 2 full years of usable historical data for trend analysis and 3 full years for projecting seasonality. It's important to note that not all provided data may be usable. For example, leading zeros and unpopulated trailing periods are ignored, and other data cleansing methods may further reduce the amount of usable data. Therefore, it is recommended to provide the forecasting model with more data than the absolute minimum requirements. Remember, the more actual data you have, the more reliable your forecast will be.