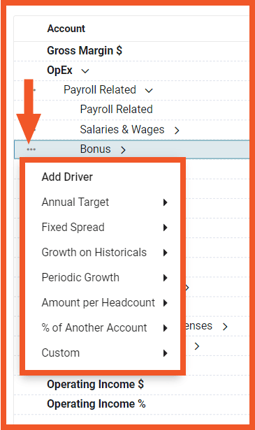
A Driver is a formulaic expression used to forecast the value of accounts within your financial plan by defining rules, growth rates, targets & other interdependencies. Drivers can be added from the individual planning tables or from Plans > Drivers. Learn more about the overall driver architecture from the Driver Overview page.
Jirav offers several types of Standard Drivers to streamline modeling: Annual Target, Fixed Spread, Growth on Historicals, Periodic Growth, Amount per Headcount, % of Another Account & Custom.
 ,
,
Click here to review how the Annual Target, Fixed Spread & Growth on Historicals drivers calculate in a spreadsheet view.
Annual Target
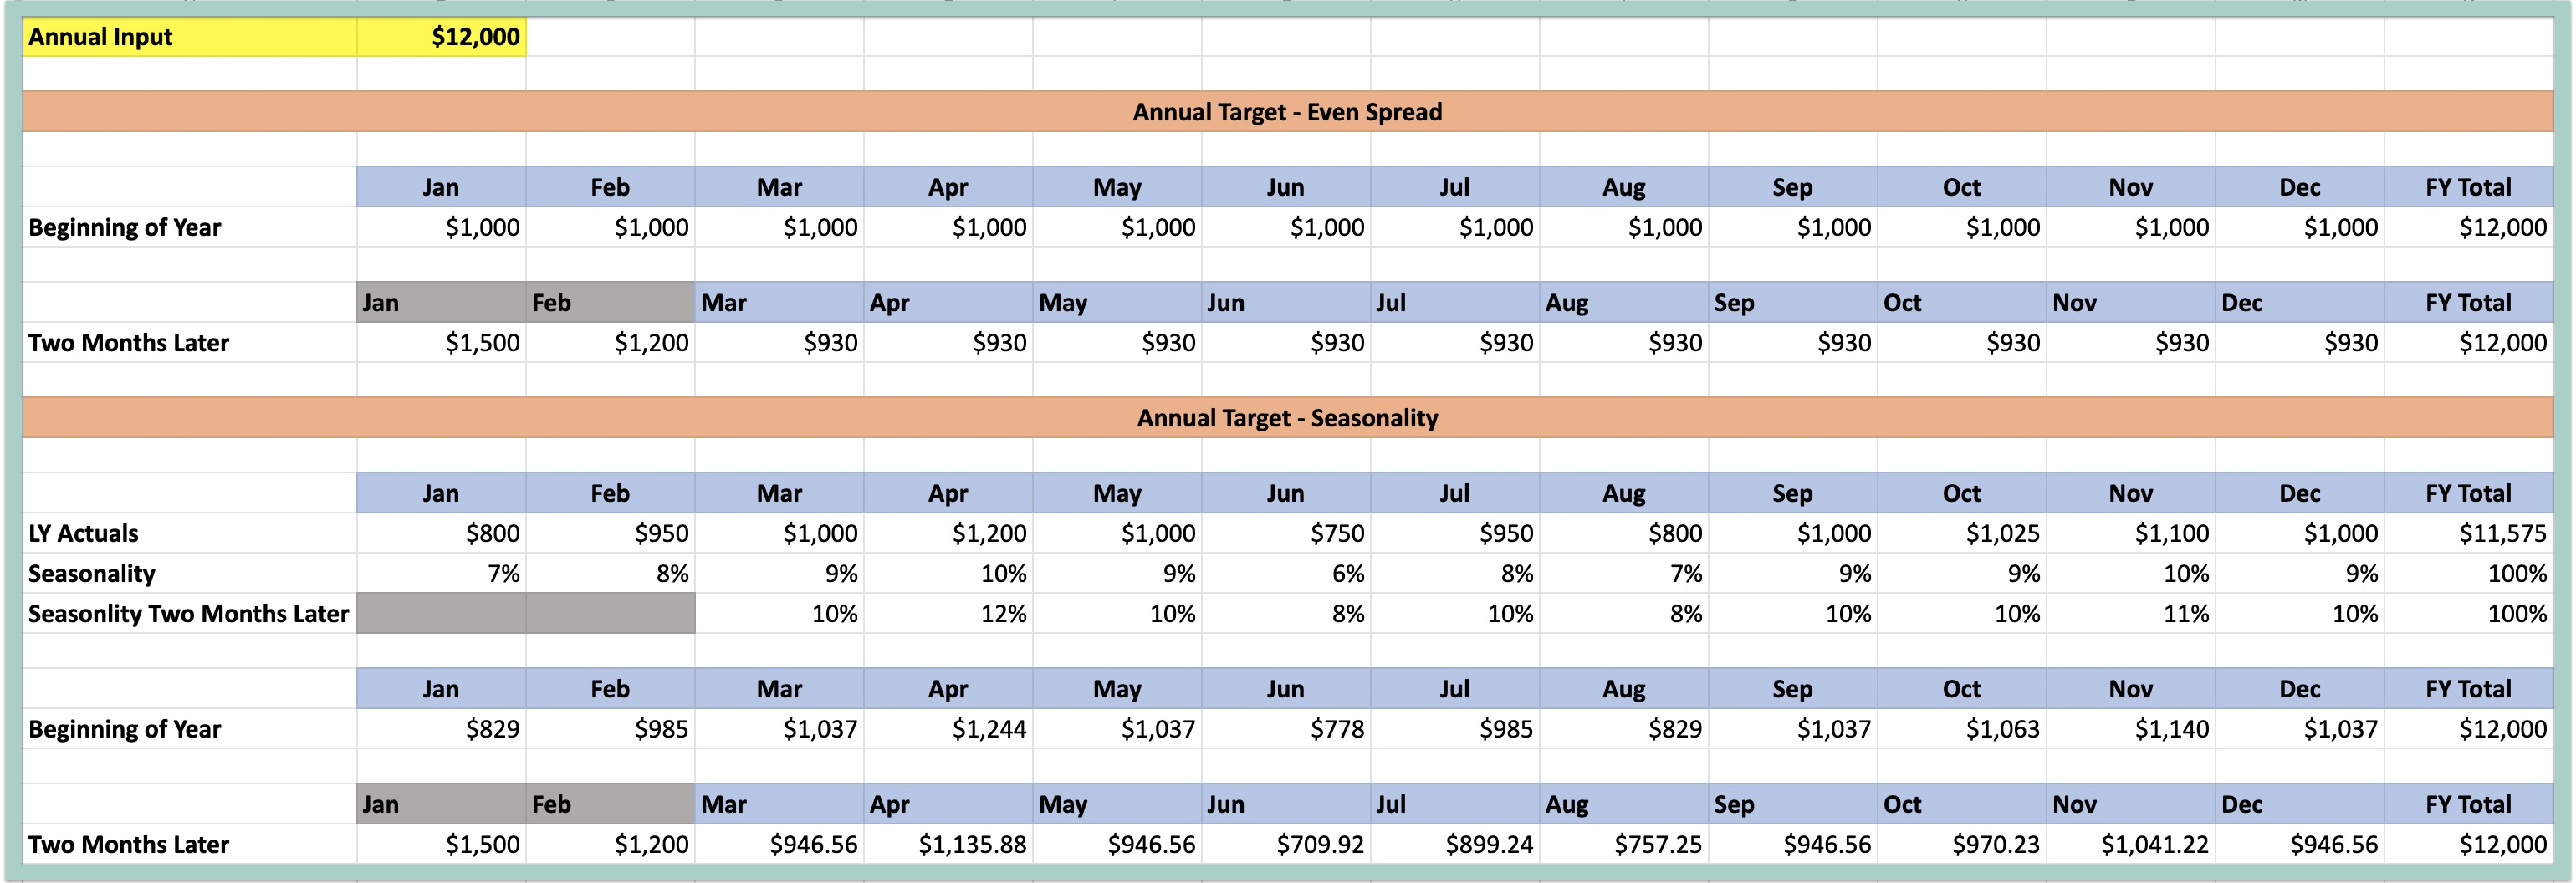
The Annual Target Driver allows you to input an annual amount that will spread over the year either evenly or based on the prior year trend. The annual target will then adjust dynamically for YTD Actuals as the forecast is rolled forward.
For example, if you set an Annual Target at the beginning of the year of $12,000 with the even split option, the forecast will be $1,000 per month. Then, if actuals come in for January and February of $1,500 & $1,200, the remaining plan months will automatically recalculate to $930 per month (($12,000-($1500+$1,200))/10)) so that the forecast remains at $12,000 for the year.
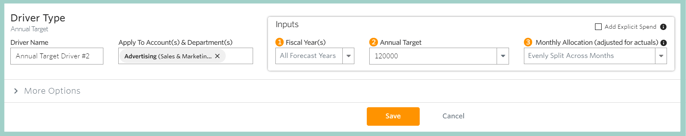
The input fields for the annual target driver are:
- Driver Name: Text field
- Apply to Account(s) & Department(s): Select the desired accounts & departments this driver should apply to
- Fiscal years(s): Defaults to all forecast years, optionally limit the driver to a single year
- Annual Target: Input annual target (only positive values)
- Monthly Allocation: Choose from Evenly split across months or Seasonality of the prior year
- Optionally access More Options to edit the Start & End Dates for the driver and add a Description
- Explicit Spend: Optionally choose to overwrite the calculation in a specific month - for example, in the below screenshot, we can see the explicit spend for May 2024 is $1,000. This results in the spend in May 2024 being equal to $1,000, then the other months are calculated as ($5,000 Annual Target - $1,000 Explicit Spend) / 9 Months (March, April, June, July, August, September, October, November, and December) = $444.
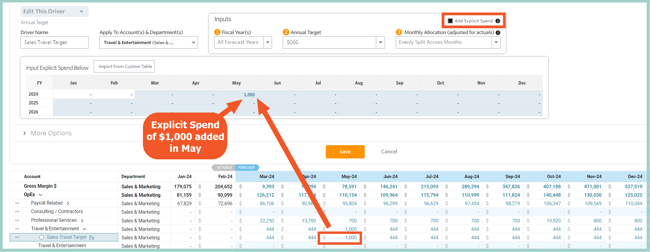
Explicit Spend can either be input directly into the Driver or linked to a line within a Custom Table. As a best practice, the Custom Table link should be used when collaborating with other users. Select Link Custom Table Line to choose the appropriate input line.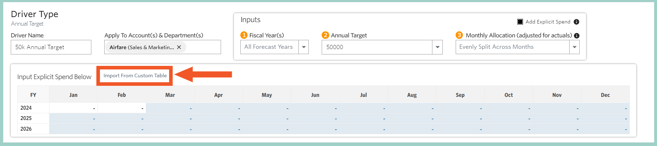
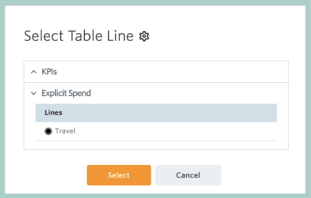
If there is not a line already available that you'd like to use for Explicit Spend, select the gear icon to navigate to Custom Table setup and add the desired line.
- Start & End Dates
- Cutover Date is the first month of the Forecast Period of your Plan (the Cutover Date is set by default for all Drivers)
- Specific Date can be any custom date within the Plan
- Min Date is the first month of the Actuals Period of your Plan
- Max Date is the last month of your Plan
- Description
Helpful Hints
- If the YTD Actuals come in higher than the Annual Target, the driver will evaluate to zero for all remaining plan months. For example, if the Annual Target is $12,000 and the Actuals for January are $14,000, the driver will evaluate to zero for February to December.
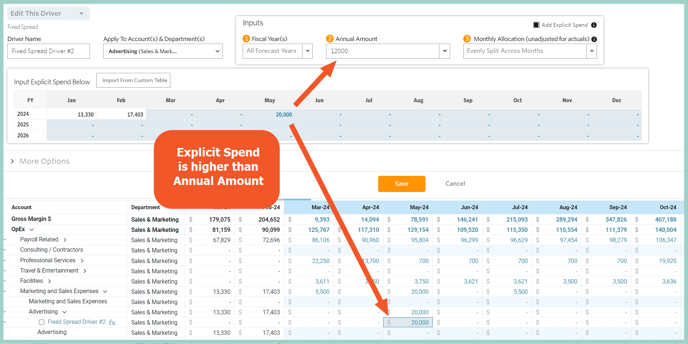
- Explicit Spend greater than the Annual Target is permitted.
Fixed Spread
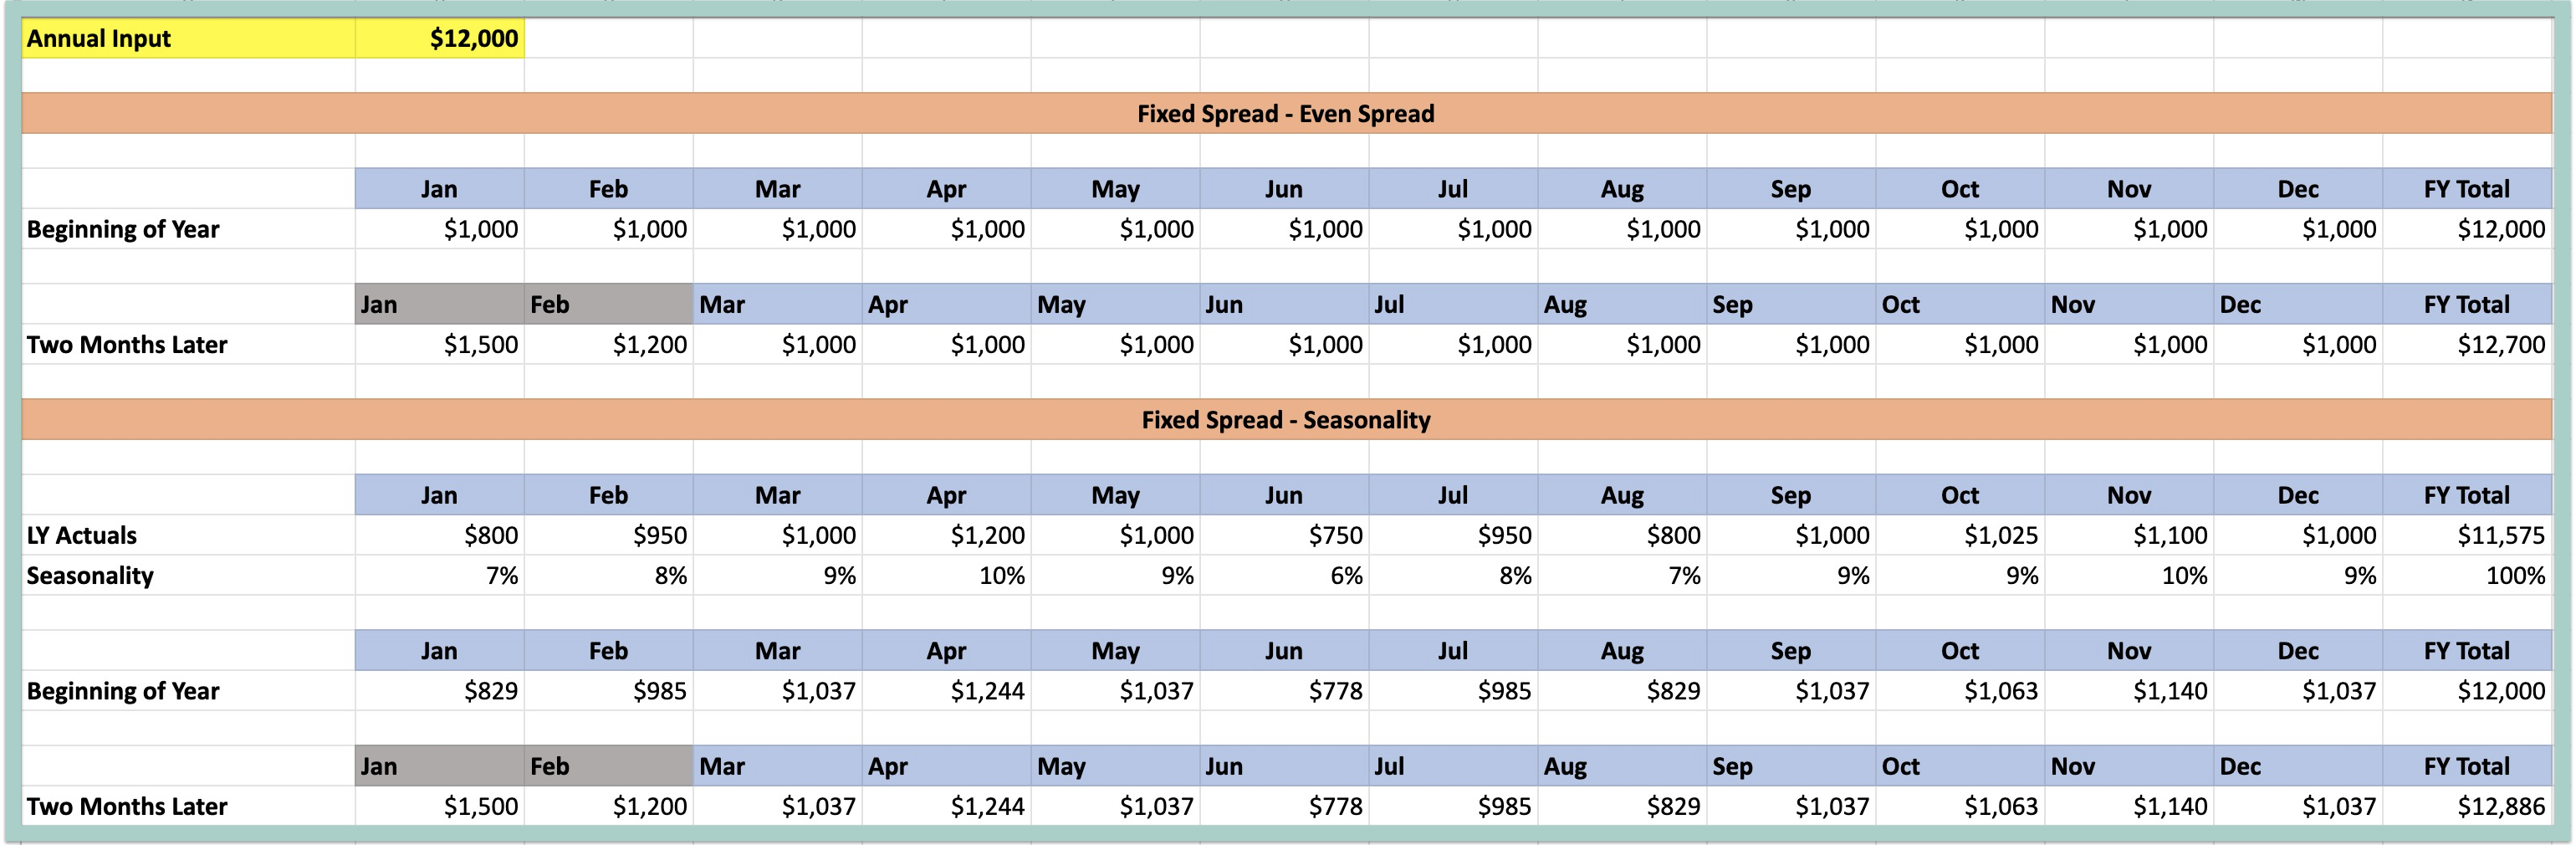
The Fixed Spread Driver allows you to input an Annual Amount which will then spread over the year either evenly or based on the prior year's trend. The fixed spread will not adjust when the forecast is rolled forward.
For example, if you set an Annual Amount at the beginning of the year of $12,000, the forecast will be $1,000 per month. Then, if actuals come in for January and February of $1,500 & $1,200, the remaining plan months will remain at $1,000 per month so that the forecast becomes $12,700 for the year.
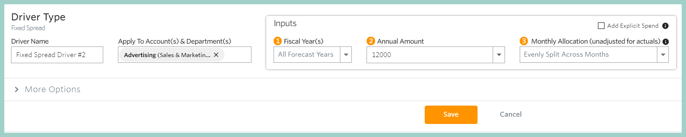
The input fields for the fixed spread driver are:
- Driver Name: Text field
- Apply to Account(s) & Department(s): Select the desired accounts & departments this driver should apply to
- Fiscal years(s): Defaults to all forecast years, optionally limit the driver to a single year
- Annual Amount: Input annual amount (only positive values)
- Monthly Allocation: Choose from Evenly split across months or Seasonality of the prior year
- Optionally access More Options to edit the Start & End Dates for the driver and add a Description
- Explicit Spend: Optionally choose to overwrite the calculation in a specific month. The Explicit Spend can either be input directly to the Driver or linked to a line within a Custom Table. Note that Explicit Spend greater than the Annual Amount is permitted.
Optionally access More Options for:
- Start & End Dates
- Cutover Date is the first month of the Forecast Period of your Plan (the Cutover Date is set by default for all Drivers)
- Specific Date can be any custom date within the Plan
- Min Date is the first month of the Actuals Period of your Plan
- Max Date is the last month of your Plan
- Description
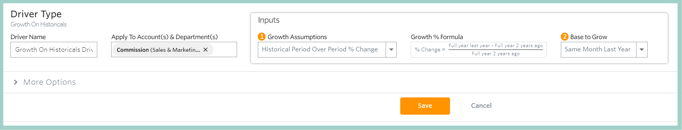
Growth on Historicals
The Growth on Historicals Driver produces a forecast by applying an assumed growth factor to the selected historical period.
For example, if actuals for 2 years ago were $10,000 and actuals for last year were $12,000, the calculated growth % would be 20% (($12.000-$10,000)/$10,000). Then, if actuals for February of last year were $1,200, the forecast for February of this year will be $1,440 ($1,200 * (1+20%)).
The input fields for the Growth on Historicals Driver are:
- Driver Name: Text field
- Apply to Account(s) & Department(s): Select the desired accounts & departments this driver should apply to
- Optionally access More Options to edit the Start & End Dates for the driver and add a Description
- Historical Period Over Period % Change (default): Takes the monthly or annual amount from the prior period and increases based on the historical year-over-year growth %.
For example, if actuals for 2 years ago were $10,000 and actuals for last year were $12,000, the calculated growth % would be 20% (($12.000-$10,000)/$10,000). Then, if actuals for February of last year were $1,200, the forecast for February of this year will be $1,440 ($1,200 * (1+20%)).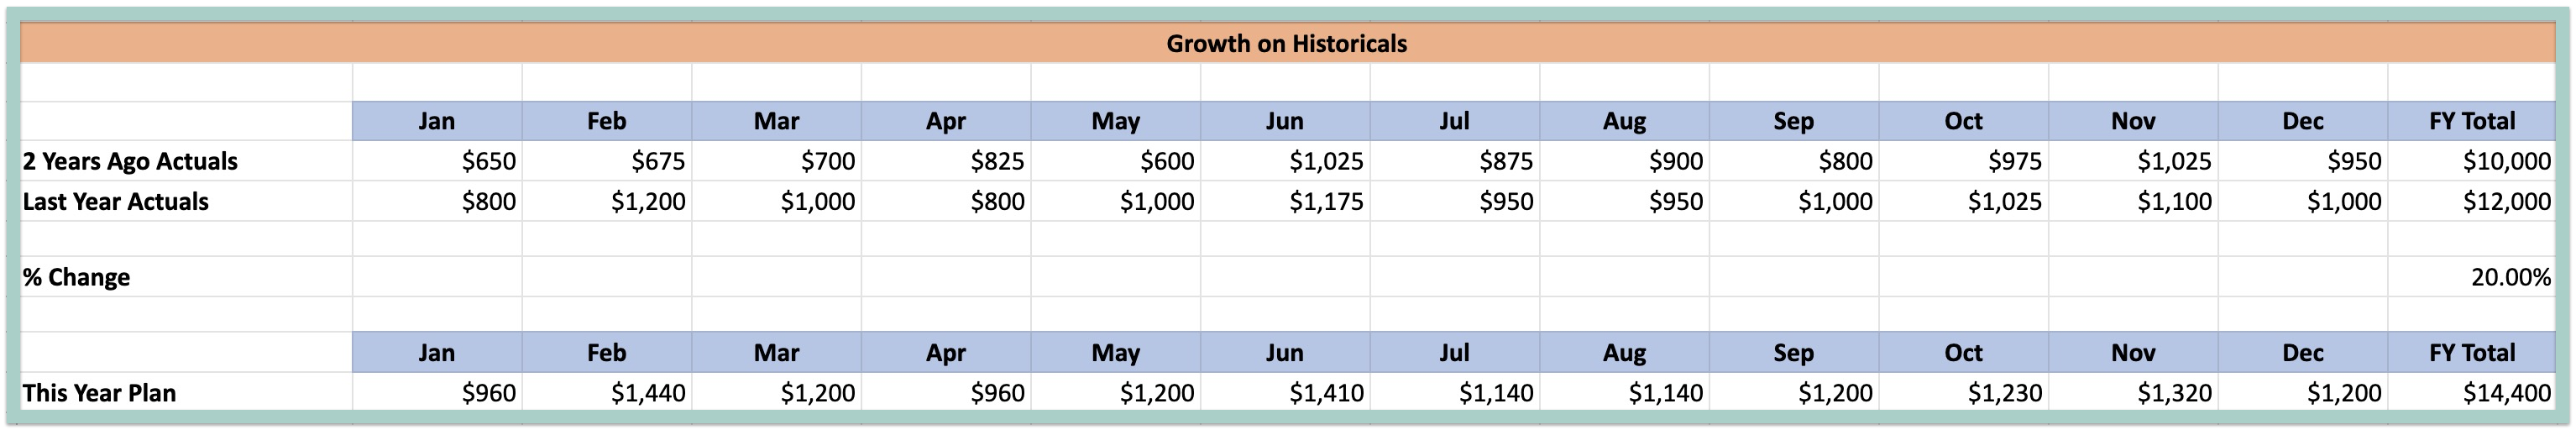
- Growth % Formula: Displays formula used to calculate % Change
- Base to Grow: Choose from Same Month Last Year or Last Year (Full Year) or input a Constant
- Driver Output Allocation (only available for Base to Grow=Last Year (Full Year): Choose Evenly Split Across Months or Seasonality of Prior Year
Helpful Hint: The Historical Period Over Period % Change driver requires that you have at least 2 years of actuals available in your plan.
Optionally access More Options for access to:
- Rounding:
- Defaults to none
- Optionally choose to round, round up, or round down the output of the driver
- Frequency
-
- Defaults to 1
- Optionally choose to alter how often the Driver evaluates
- For example, a frequency of 1 means the driver will evaluate monthly whereas a frequency of 3 means the driver will evaluate quarterly
- Start & End Date
- Cutover Date is the first month of the Forecast Period of your Plan (the Cutover Date is set by default for all Drivers)
- Specific Date can be any custom date within the Plan
- Min Date is the first month of the Actuals Period of your Plan
- Max Date is the last month of your Plan
- Description
Periodic Growth
The Periodic Growth Driver grows the value periodically, either by a % or $ amount.
Periodic # Increase takes the previous monthly or historical average and increases periodically by a #. For example, the forecast could be calculated as a Trailing 3-month average of an account plus $500 every quarter.
Increase by 🔲 every 🔲 Month(s): Enter the amount the account should increase by and how frequently
Increase Start Month
Choose one of the following:
- First Increase Period in Forecast
Applies the first increase in the month of the start of the Forecast Period + the input # of Months. For example, if the Forecast Period starts in February 2024 and the increase is set to apply every 3 months, the first increase will occur in May 2024. - Specific Month
Select the desired month the increase should start. - Relative Month
Applies the first increase in the 1st month of the next fiscal quarter. For example, if the Forecast Period starts in February 2024, the first increase will occur in April 2024.
Choose one of the following:
- Actuals
- Last month of actuals
- Last 3 months (average)
- Last 6 months (average)
- Last 12 months (average)
- Last fiscal quarter (average)
- Last fiscal half (average)
- Actuals since last year (average)
- Actuals this year (average)
- Constant
- Custom
- Customize the Start and End Month and the Calculation type
Periodic % Increase takes the previous monthly or historical average and increases periodically by a %. For example, the forecast could be calculated as a Trailing 3-month average of an account and increase by 10% quarterly.
Increase by 🔲% ever 🔲 Months: Enter the amount the account should increase by and how frequently
Increase Start MonthChoose one of the following:
- First Increase Period in Forecast
Applies the first increase in the month of the start of the Forecast Period + the input # of Months. For example, if the Forecast Period starts in February 2021 and the increase is set to apply every 3 months, the first increase will occur in May 2021. - Specific Month
Select the desired month the increase should start. - Relative Month: Next fiscal quarter (Month 2)
Applies the first increase in the 2nd month of the next fiscal quarter. For example, if the Forecast Period starts in February 2024, the first increase will occur in May 2024.
Base to Grow
Choose one of the following:
- Actuals
- Last month of actuals
- Last 3 months (average)
- Last 6 months (average)
- Last 12 months (average)
- Last fiscal quarter (average)
- Last fiscal half (average)
- Actuals since last year (average)
- Actuals this year (average)
- Constant
- Custom
- Customize the Start and End Month and the Calculation type
Optionally access More Options for access to:
- Rounding:
- Defaults to none
- Optionally choose to round, round up, or round down the output of the driver
- Frequency
- Defaults to 1
- Optionally choose to alter how often the Driver evaluates
- For example, a frequency of 1 means the driver will evaluate monthly whereas a frequency of 3 means the driver will evaluate quarterly
- Start & End Date
- Cutover Date is the first month of the Forecast Period of your Plan (the Cutover Date is set by default for all Drivers)
- Specific Date can be any custom date within the Plan
- Min Date is the first month of the Actuals Period of your Plan
- Max Date is the last month of your Plan
- Description
Amount per Headcount
The Amount per Headcount driver allows you to reference either the Cumulative Headcount or New Headcount metric from the Staffing module and then multiply by an input rate or assumption.
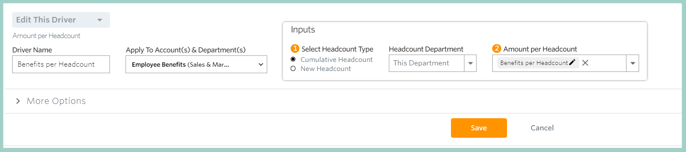
The input fields for the Amount per Headcount driver are:
- Driver Name: Text field
- Apply to Account(s) & Department(s): Select the desired accounts & departments this driver should apply to
- Select Headcount Type: Choose Cumulative or New Headcount from the Staffing module
- Headcount Type Department: Select the desired Department. When applying Drivers to multiple Departments, use This Department to dynamically reference the department where the driver is being added
- Amount per Headcount: Choose to enter a hardcoded number or select an assumption
- Optionally access More Options to edit the Start & End Dates for the driver and add a Description
Optionally access More Options for access to:
- Rounding:
- Defaults to none
- Optionally choose to round, round up, or round down the output of the driver
- Frequency
-
- Defaults to 1
- Optionally choose to alter how often the Driver evaluates
- For example, a frequency of 1 means the driver will evaluate monthly whereas a frequency of 3 means the driver will evaluate quarterly
- Start & End Date
- Cutover Date is the first month of the Forecast Period of your Plan (the Cutover Date is set by default for all Drivers)
- Specific Date can be any custom date within the Plan
- Min Date is the first month of the Actuals Period of your Plan
- Max Date is the last month of your Plan
- Description
% of Another Account
The % of Another Account driver allows you to reference another account of your choosing and then multiply by an input % or assumption.
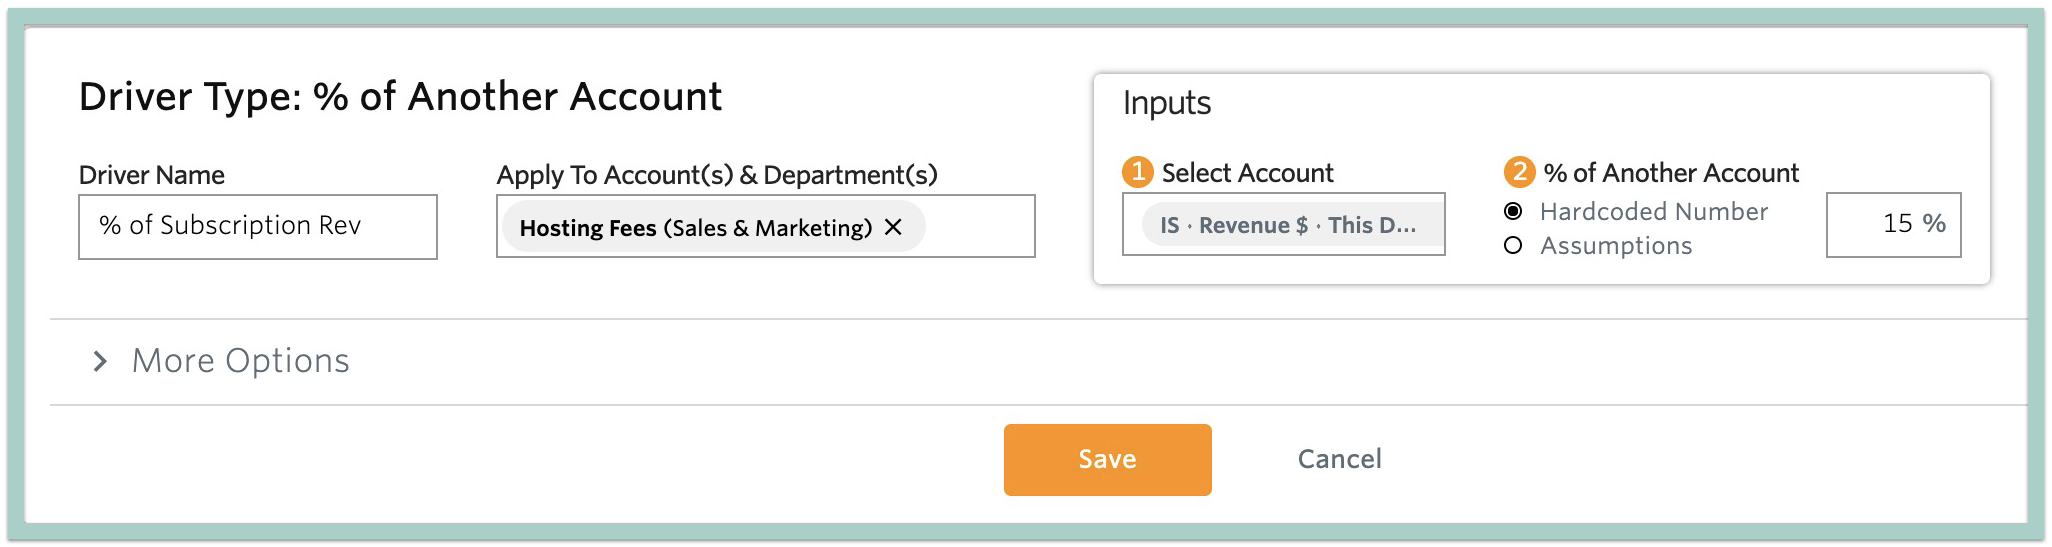
The input fields for the % of Another Account driver are:
- Driver Name: Text field
- Apply to Account(s) & Department(s): Select the desired accounts & departments this driver should apply to
- Select Account: Choose the desired Account & Department to reference. When applying Drivers to multiple Departments, use This Department to dynamically reference the department where the driver is being added
- % of Another Account: Choose to enter a hardcoded number or select an assumption
- Optionally access More Options to edit the Start & End Dates for the driver and add a Description
Optionally access More Options for access to:
- Rounding:
- Defaults to none
- Optionally choose to round, round up, or round down the output of the driver
- Frequency
-
- Defaults to 1
- Optionally choose to alter how often the Driver evaluates
- For example, a frequency of 1 means the driver will evaluate monthly whereas a frequency of 3 means the driver will evaluate quarterly
- Start & End Date
- Cutover Date is the first month of the Forecast Period of your Plan (the Cutover Date is set by default for all Drivers)
- Specific Date can be any custom date within the Plan
- Min Date is the first month of the Actuals Period of your Plan
- Max Date is the last month of your Plan
- Description
Custom
A custom driver allows you to customize the selected inputs and functions. Custom Driver gives the possibility of doing the calculation (+, -, x, /) between Input 1 and Input 2.
Each Input can be customized regarding Data Elements such as Account, Department, Range, and Reduction.

For example, if you wanted to calculate Advertising as a % of Revenue, Input 1 would point to the Revenue account, fx would be x, and Input 2 would be the desired Constant %.
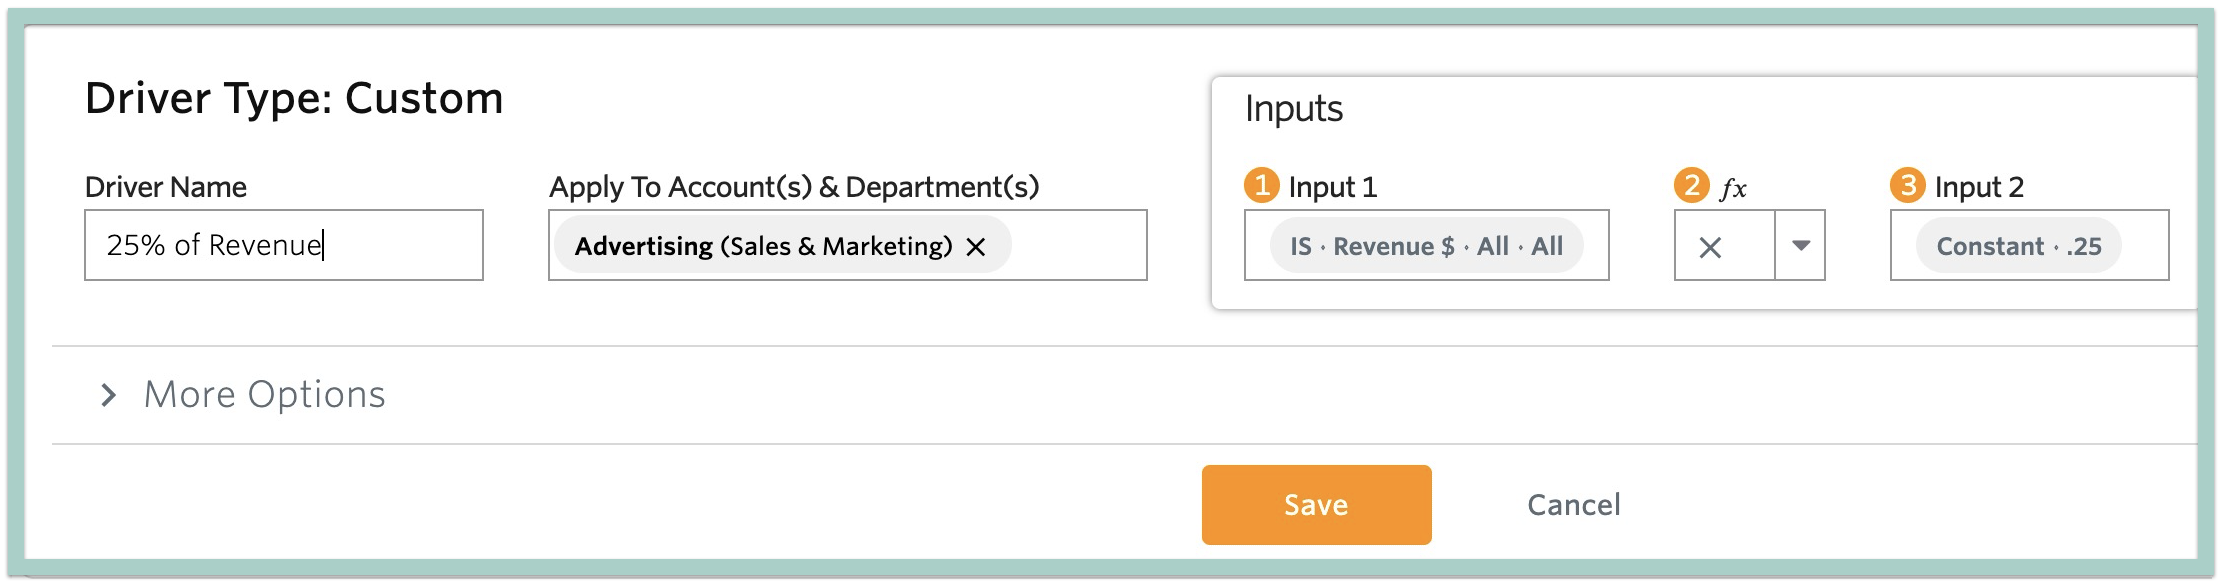
The input fields for the custom driver are:
- Driver Name: Text field
- Apply to Account(s) & Department(s): Select the desired accounts & departments this driver should apply to
- Input 1: Select a variable from within Jirav, e.g., Revenue, Headcount, Custom Lines or Assumptions, or enter a Constant
- This Department will match the Department to which this driver is applied to
- This Account will match the Account this driver is applied to
- fx: Choose addition, subtraction, multiplication or division
- Input 2: Select a variable from within Jirav, e.g., Revenue, Headcount, Custom Lines or Assumptions, or enter a Constant
- This Department will match the Department to which this driver is applied to
- This Account will match the Account this driver is applied to
Optionally access More Options for access to:
- Rounding:
- Defaults to none
- Optionally choose to round, round up, or round down the output of the driver
- Frequency
-
- Defaults to 1
- Optionally choose to alter how often the Driver evaluates
- For example, a frequency of 1 means the driver will evaluate monthly whereas a frequency of 3 means the driver will evaluate quarterly
- Div/0
- Default setup to On
- Most DIV/0 errors occur when a driver is waiting for input and currently has a blank or zero (0) value. Enabling the ON option treats these occurrences as zeros instead of errors.
- Start & End Date
- Cutover Date is the first month of the Forecast Period of your Plan (the Cutover Date is set by default for all Drivers)
- Specific Date can be any custom date within the Plan
- Min Date is the first month of the Actuals Period of your Plan
- Max Date is the last month of your Plan
- Description
Updated for April 2024