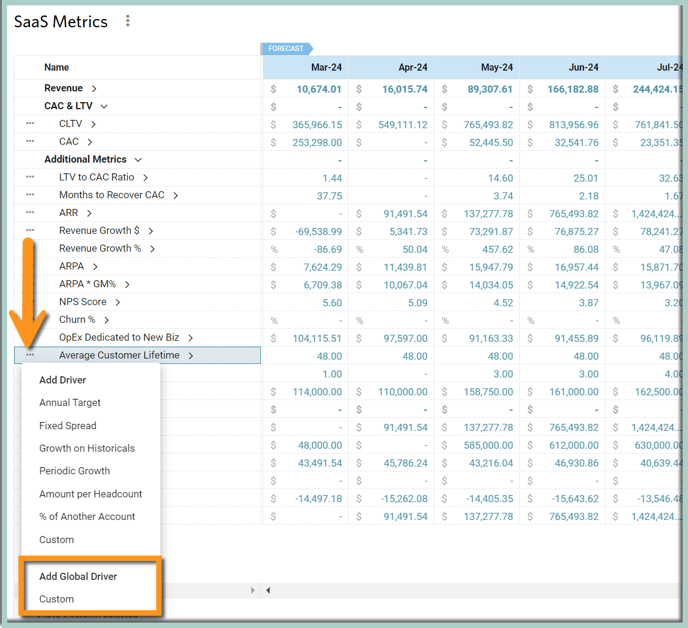
This article contains a summary of commonly reported Saas Metrics as well as examples of how Global Drivers can be used to calculate these metrics under Custom Tables.
- ARR
- ACV
- CAC
- Churn %
- Expansion %
- Average Margin per Customer
- LTV
- LTV/CAC
- Months to Recover CAC
- Retention Rate
Annual Recurring Revenue (ARR)
Annual Recurring Revenue is the amount of revenue that is expected to be repeated. Its measurement and analysis allow predict the company's progress and future growth. It incorporates all components of revenue including sales, renewals, expansion, and churn.
Global Driver formula: Ending Monthly Recurring Revenue (MRR) * Constant 12 (months)
Average Contract Value
Average Contract Value indicates how much the average contract is worth across the entire customer base. This metric can be used to forecast new sales as well as future churn. For example, when forecasting future churn it often is more accurate to reference the Average Contract Value from 12 months ago rather than the current Average Contract Value.
Global Driver formula: Total Bookings / Total Customers or New Bookings / New Customers
Customer Acquisition Cost (CAC)
CAC tells us how expensive it is for us to acquire a new customer. It is an important profitability metric to track to ensure that the cost of acquiring a customer is not more than the expected lifetime value of that same customer. This metric can also be used to forecast new customers based on advertising spend. For example, if we know that our historical CAC is $500, then by spending $500,000 on marketing, we can expect 10,000 new customers.
Global Driver formula: Operating Expenses Dedicated to New Biz / New Customers where Operating Expenses Dedicated to New Biz might be a % of total OpEx or OpEx for just the Sales & Marketing Departments
Churn %
The Churn Rate shows the lost revenue value. Churn Rate forecasting allows for predicting a company’s profitability and adjusting the business strategy, for example, improving customer retention.
Global Driver formula: Lost Revenue from Churn / Revenue Beginning of the Period or Lost Customers / Customers Beginning of the Period
Expansion %
The Expansion Rate allows for tracking of revenue growth from the company's existing customers. Similar to Churn Rates, the Expansion Rate gives the possibility to forecast future profits.
Global Driver formula: Revenue from Expansion / Revenue Beginning of Period
Average Margin per Customer
This tells us the average revenue per customer after any cost of goods sold. For example, if the average revenue per customer is $100,000, but each customer requires $90,000 in hosting fees, the average margin is just $10,000 per customer.
Global Driver formula: (Ending MRR/Ending Customers) * Gross Profit %
LTV
Lifetime Value of a Customer is a revenue value that is predicted to be earned from a customer over time. An LTV higher than CAC indicates profitability. As the Churn goes down, the LTV will increase.
Global Driver formula: Average Margin per Customer / Churn %
LTV / CAC
LTV / CAC Ratio allows for comparing a customers' lifetime value to the amount of cost spent on acquiring them. A good ratio (usually 6x or higher) shows good growth potential with a low level of marketing investment while a low ratio means that the cost to acquire new customers is too high, hence, there is a high possibility that the company might need future funding.
Global Driver formula: LTV / CAC
Months to Recover CAC
Months to recover CAC shows the amount of time (months) required to recover investments in customer acquisition. In general, the lower the ratio is, the less capital the company will use.
Global Driver formula: CAC / Average Margin per Customer.
Retention Rate
Retention Rate indicates how many users continue using a company's product or service over a given time period. In other words, it's a company’s ability to make customers into repeat customers, instead of buying from a competitor. A high retention rate is desirable as it is generally more profitable to upsell to existing customers than to acquire new customers.
Global Driver formula: (End of Period Customers - New Customers) / Beginning of Period Customers)