Release Notes - 2024
Learn about newly released product features.
December 2024
Version 24.12
Report Column Headers
- Email support@jirav.com to enable the Report Column Headers feature
- Learn how to optimize your Report presentation by customizing Report Column Headers

Reorder Custom Tables and Report Sections
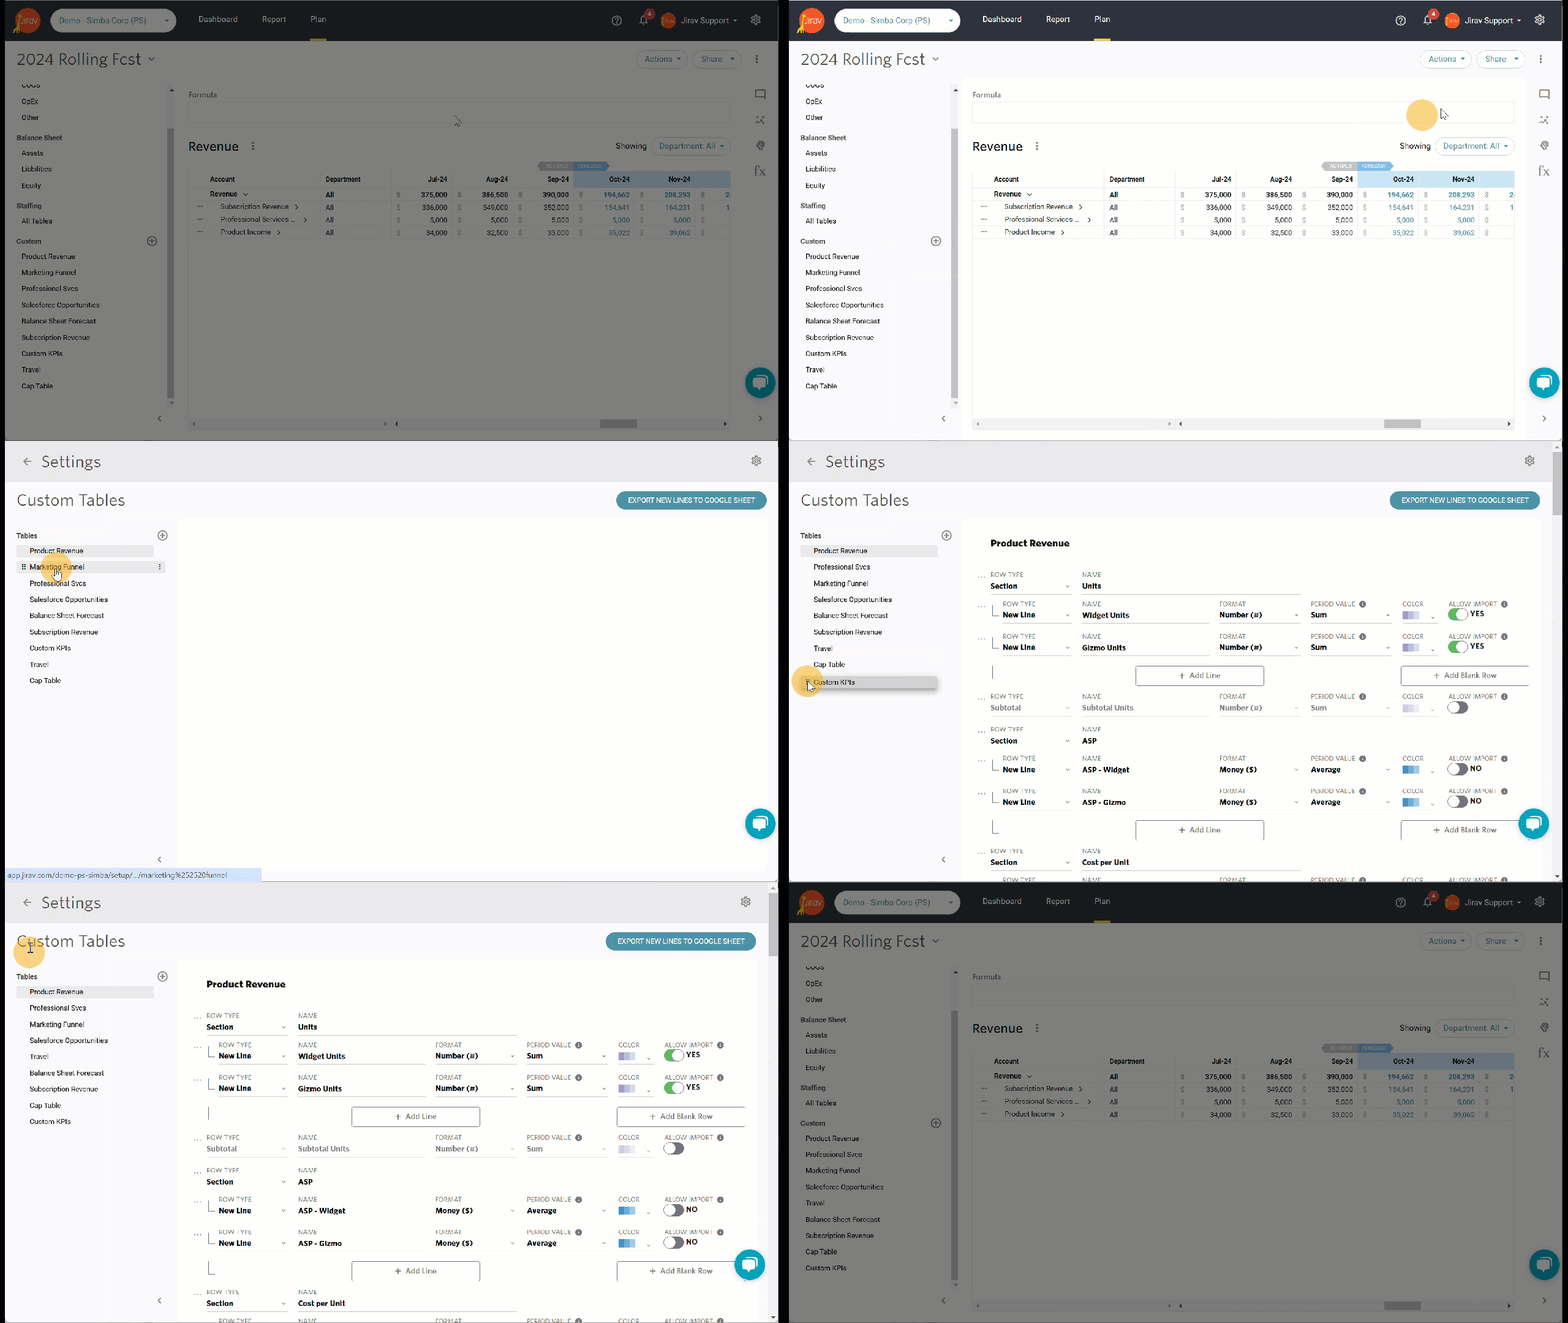
- Custom Table
- Reports

Hide all Sections in the Executive Summary & Income Statement Reports
- Executive Summary

- Income Statement

November 2024
Version 24.11
Remove Global Driver Errors from Plans
- Before: when a Global Driver contained an error (ex. if one of the inputs was deleted), there would be an error message in System Health for every active Plan despite it being just one Global Driver
- Now: there is a single global error within the System Health

Update Report formatting sidebar

October 2024
Version 24.10
Pre-populate GSheet Template with Dates
- The Google Sheet is pre-populated with dates where there’s a column for each month in the 2 prior Fiscal Years and extends forward for the rest of the years and 1 year into the future

Pre-populate Custom Table Excel Template

Headcount Terminated #
- Headcount Terminated count is available for Departments & Roles from Custom Drivers view
- The Headcount's termination calculation is expressed as a positive number

Left align Table Tile Account Header

Remove "$" from Gross Margin, Operating & Net Income Row Headers in Reports

September 2024
Version 24.09
“Powered by Jirav” will not appear in PDF exports of a report

Support for System Salaries with Auto-Forecast
- Disabling Auto-Forecast for Salaries will now automatically result in System Salaries calculating

August 2024
Version 24.08
UA Picker "Key Assumptions" labeled to "Assumptions"

Assumptions Side Sheet Update

Dashboard Settings App Shell Migration

Drivers and Manual Entries support for non-AF lines
- Ability to add Drivers or manual inputs to lines that are not being automatically forecasted

July 2024
Version 24.07
Increased Tile Name length to 60 characters
- The number of characters has been expanded from 20 to 60
- Added the ability to see the Tile Name upon hover


Updated Notifications
- Select or de-select which E-Mail Notifications you would like to receive

Report Source UI and Terminology Updates
-
Label Updates
-
The three Sources in each Report configuration was previously referred to as Column 1, Column 2 and Column 3. They will now be referred to as Primary Source, Comparison Source 1 and Comparison Source 2

- The Report Period date picker has been relabeled as Date Range and the Period for the comparison sources has been relabeled as Relative Date Range
- The Report Columns dropdown where users select how they want their reports to be aggregated (Months, Quarters, and Year Halves, Years and Total) has been relabeled at “Show Dates By”

-
- Side Sheet Reorganization
- The Date Range picker (prev. Report Period) has been pulled down to be selected within the Primary Source

- The "Show Dates By" dropdown (prev. Report Columns) will also be selected within the primary source

- The Date Range picker (prev. Report Period) has been pulled down to be selected within the Primary Source
-
- Department Filter, Show Notes control, and Show Partial Total Footnotes Control all moved to “Report Level” settings at the top

- Department Filter, Show Notes control, and Show Partial Total Footnotes Control all moved to “Report Level” settings at the top
- Relative Date Range Addition
- Two new options were added to the Relative Date Range dropdowns for the comparison sources:
- Next Period
- Next Year
- Two new options were added to the Relative Date Range dropdowns for the comparison sources:

Report Variance Dropdown Update
-
The variance dropdowns now reference the chosen sources and date ranges so that selecting a variance calculation is easy and without confusion

Staff List Report "Edit Columns" Update
-
The controls that were not relevant to the Staff List report were removed to create a less confusing setup
-
The date picker is labeled as “Employed During”

New format options in exported Text Page to Excel
-
Formatting that is added to a Text page will be exported to Excel, including pictures

QuickBooks Desktop Web Connector - Beta
- The UI for integrating with QBD using the QuickBooks Web Connector is now in the application behind a feature flag
- Users who have this feature flag turned on will be able to choose with integration method they would like to use - Autofy or QBWC

June 2024
Version 24.06
Add Data Labels & Legend to the Dashboard Tiles
- Customize Data Labels by showing or hiding Values and Series Name
- Tile's Legend can be turned on or turned off
- Data Labels & Legend will be displayed in the exported PDF


Customize Text Page with text editor capabilities such as:
- 12 Common Fonts
- Font Colors
- Underline & Strikethrough
- Indent/Outdent
- Numbered & Bullet lists
- Emojis
- Clear Formatting

Export Excel with Formats:
- Export the format changes you built in your Reporting Packages into Excel and Google Sheets

Updated Company Settings Page


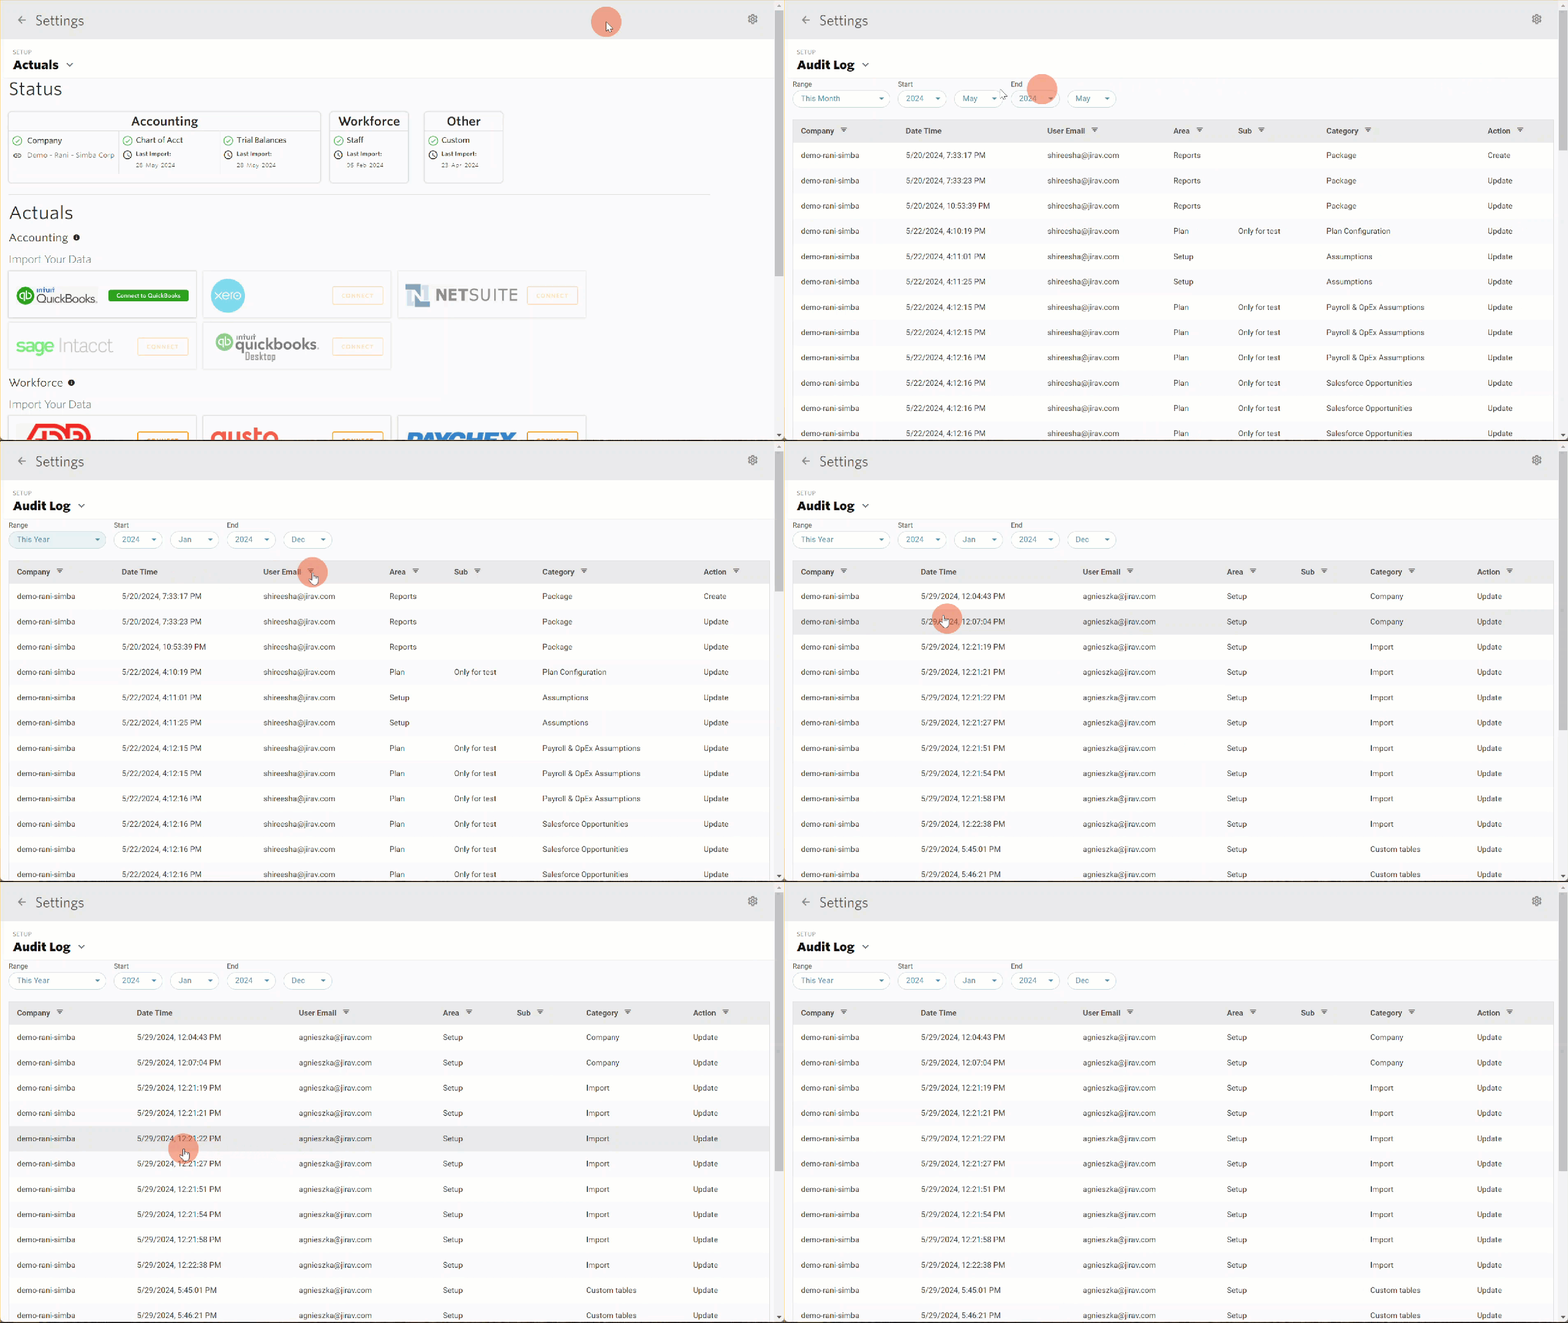
Updated Audit Log Page
- Review Audit Logs for the desired Range (This Month, This Year, Custom)
- Click on the specific row to display action details
May 2024
Version 24.05
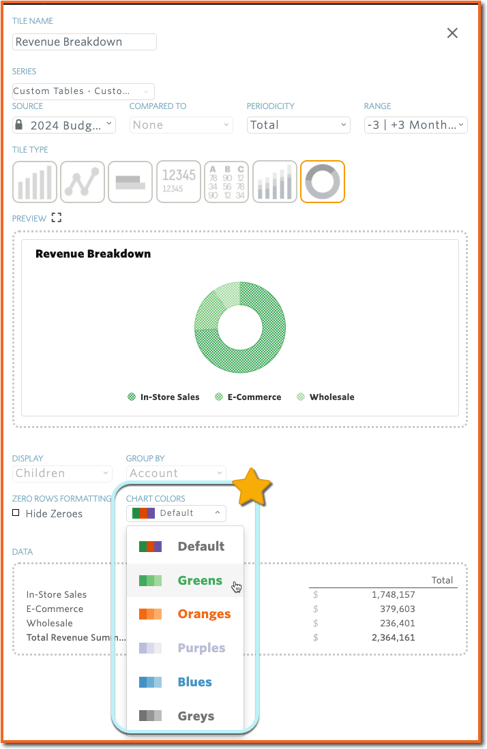
Change Colors from Dashboard Tiles
- Modify the color of a specific data series directly from the dashboard tile.
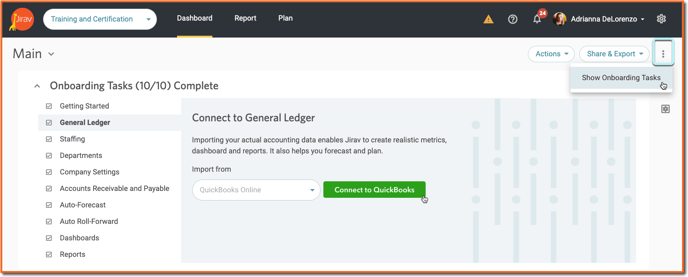
Updated In-App Onboarding Steps
- Easily set up new accounts by completing the onboarding tasks.
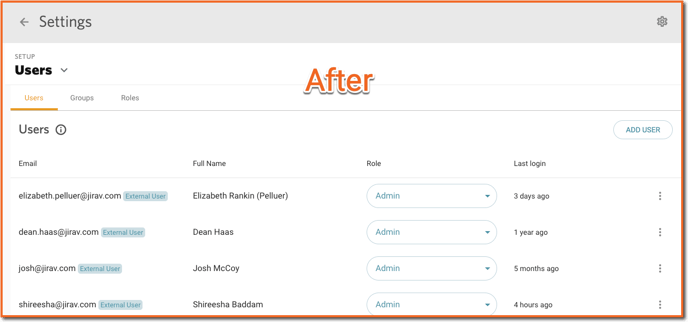
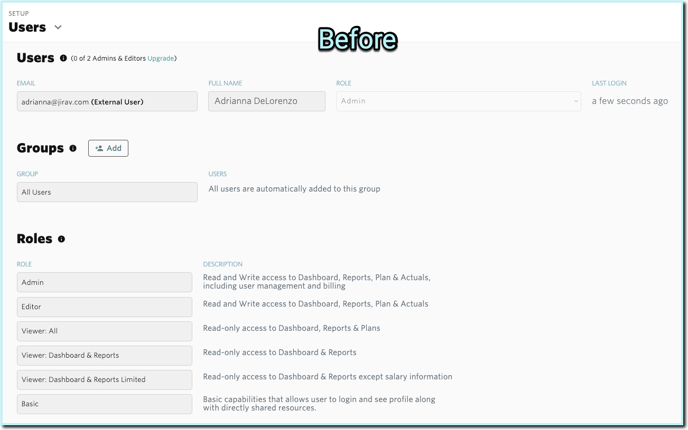
Updated Users Page
Updated Assumption Settings Page


April 2024
Version 24.04
Automatic Roll Forward
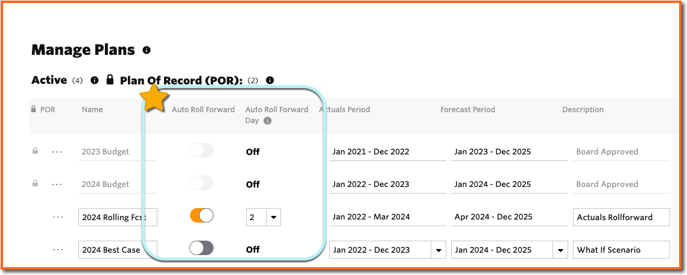
- Enable plans to roll forward automatically to include an additional month of actuals - enable the setting from Plans > Manage Plans
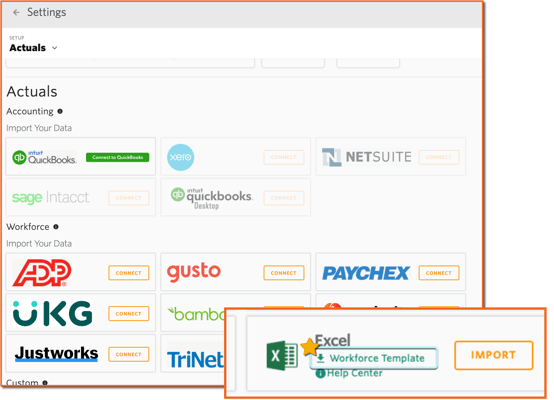
Excel Workforce Template Staff List Download
- Excel Workforce Template download is now populated with the current list of employees per the Workforce module
Balance Sheet Out of Balance Automatic Heal
- Jirav now detects when your balance sheet is out of balance and reimports actuals to correct the out of balance automatically* for all periods previously imported
*Account must be set to automatically import actuals and this feature does not apply to QuickBooks Desktop or Excel integrations
Plan Row Preservation
- Consistency in account expansion levels is maintained when switching departments within planning tables, enhancing efficiency during data input and analysis
March 2024
Version 24.03
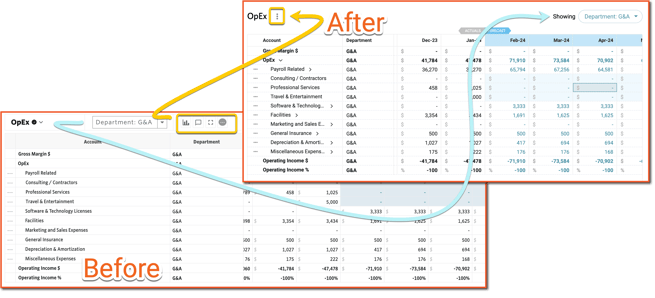
Enhanced Plan Tables
-
Improved planning tables with a visually appealing design to facilitate smoother data input and review processes
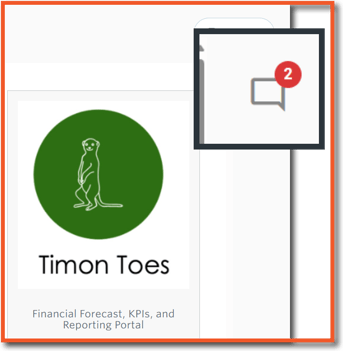
Visual Comment Alerts
-
Receive visual alerts indicating the number of unread comments across all sections of the application - once viewed the visual alert will disappear
Formula Bar Support for Balance Sheet and Allocation Drivers
-
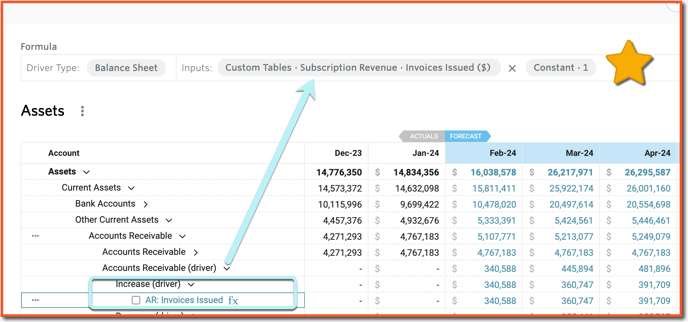
Balance Sheet and Allocation Drivers are now visible in the planning tables, eliminating the need to navigate to the Drivers area to view these formulas
February 2024
Version 24.02
Auto-Forecast Enhancements (Beta)
- Enable Auto-Forecast by Account & Department
- Additional Forecast Methodologies for Linear Trend without Seasonality and Simple Average
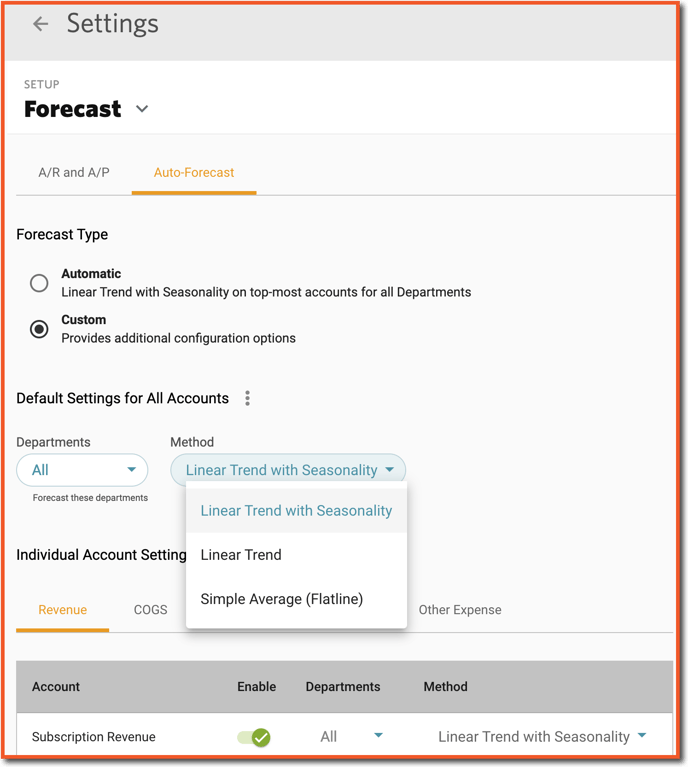
Learn more about Auto-Forecast.
PDF Report Enhancement
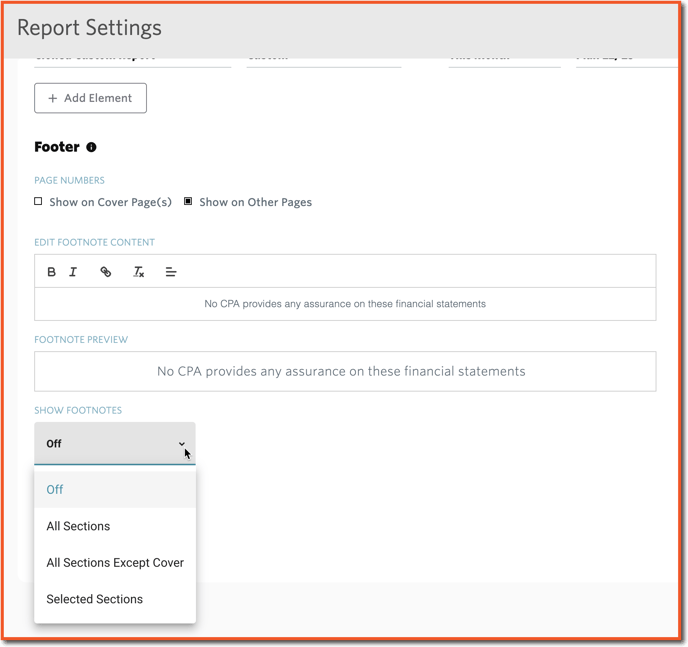
- Choose which report sections to include Footnotes on
