Reports allow you to customize your report to meet your exact needs. You can choose the time ranges, data elements, sources, and format that best suit your preferences. This article contains a detailed overview of each area of customization within reports.
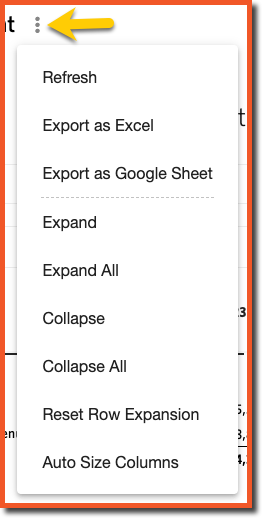 |
Refresh the report on the screen to reflect any changes made to the underlying data. This is a convenient feature as it saves time compared to refreshing the entire browser window. Additionally, using this button does not erase any settings you have not yet saved.
|
|
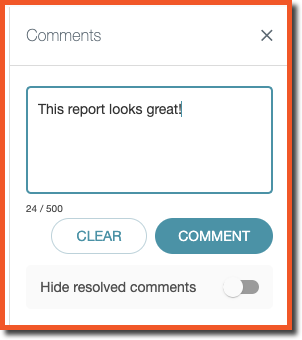 |
Make a comment at the report level | |
 |
|
|
 |
 |
|
 |
 |
|
 |
|
|
 |
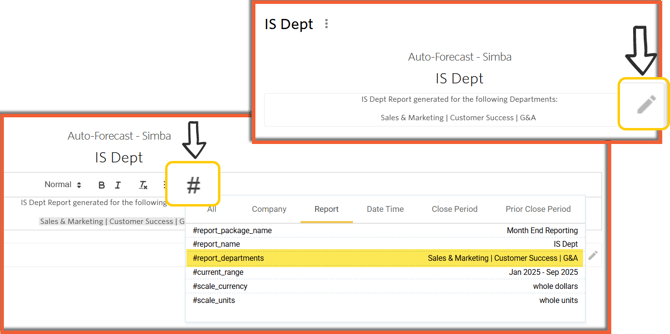 |
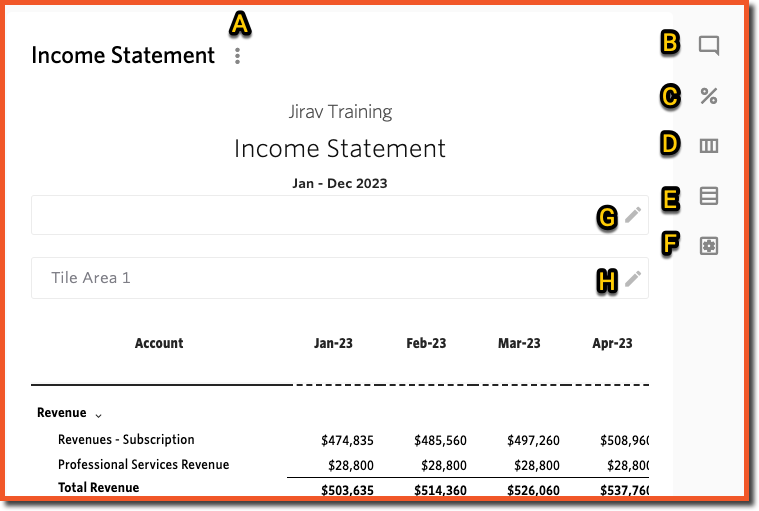
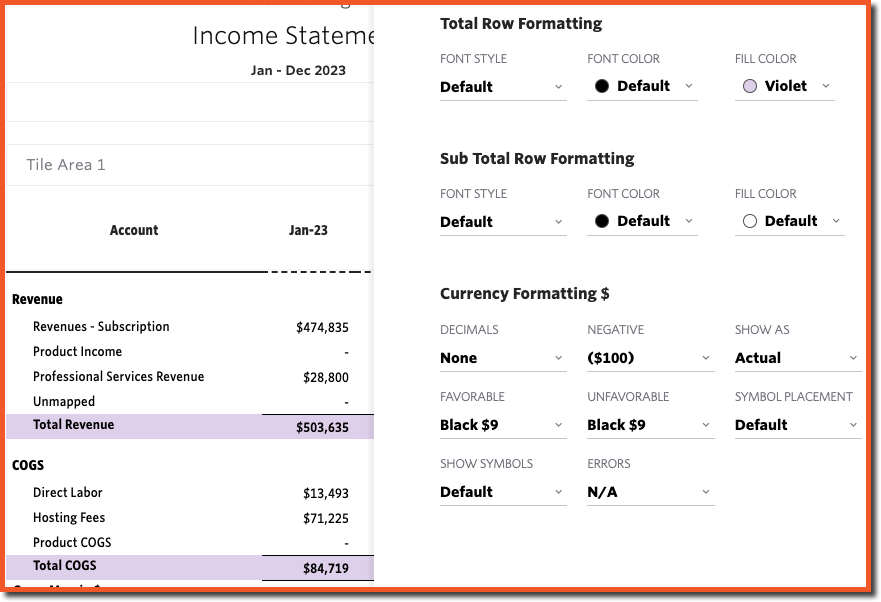
Add a text commentary to the financial results displayed in the report. Smart Labels allow users to reference global metadata that will automatically update. This can be accessed via the “#” button or by simply typing “#” in the text editor. |
 |
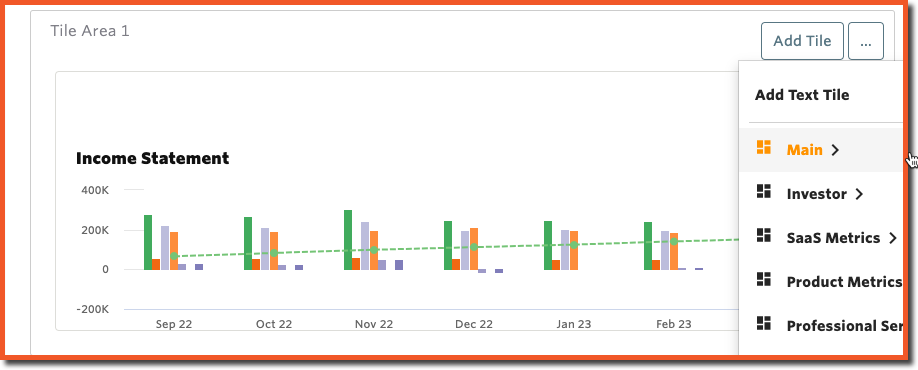 |
Add Tiles from the Dashboard area to the report to visually represent key data. |
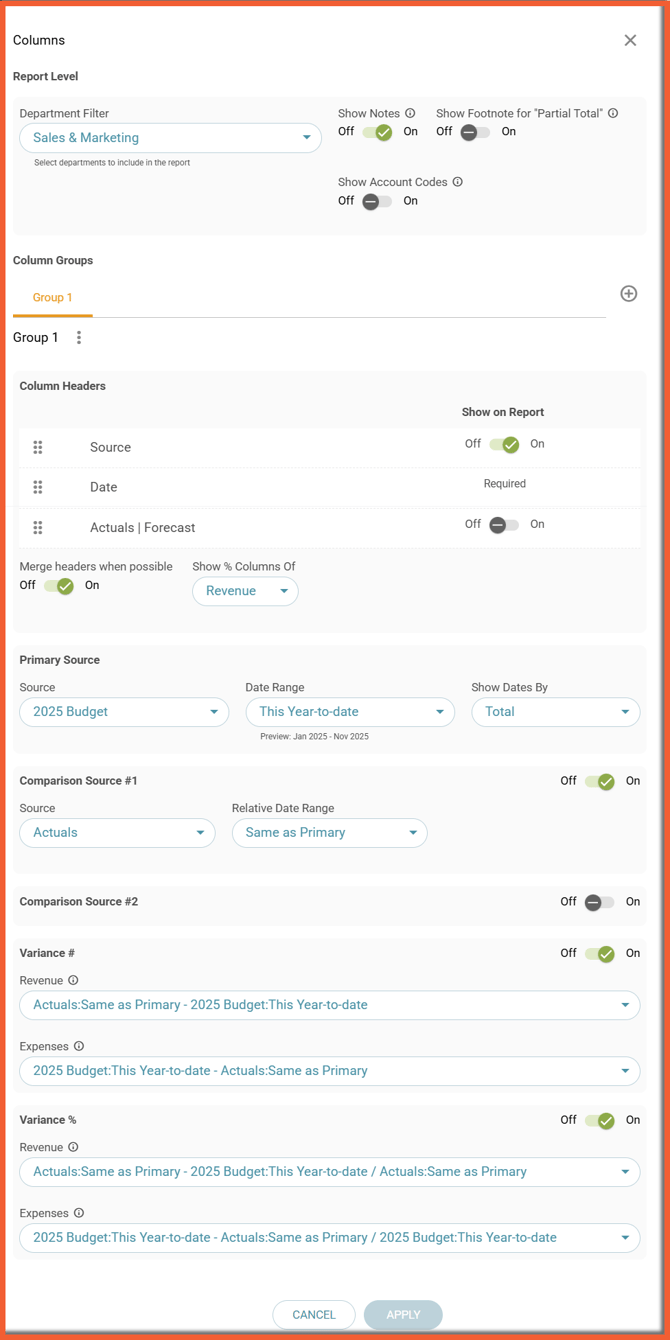
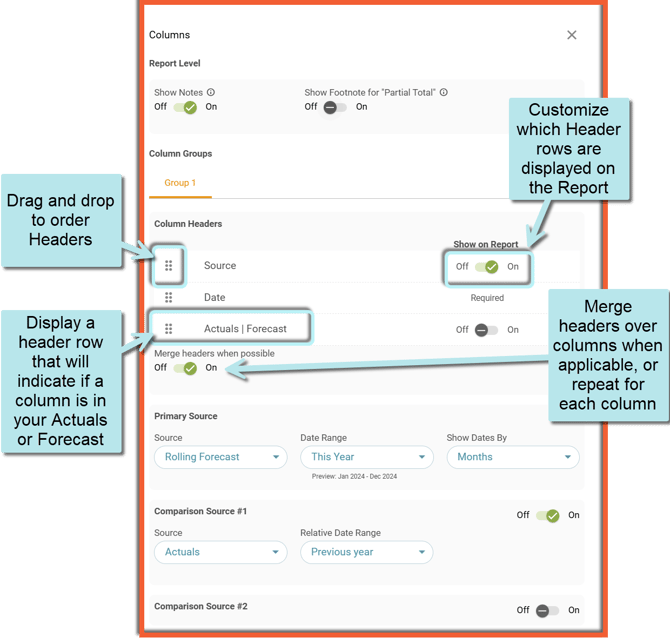
Report Column Headers Customization (related to ![]() Section) where
Section) where
- Headers can be shown or hidden via an on/off switch
- The Date Header cannot be turned off
- Headers can be ordered manually by dragging and dropping from the default order, which is:
- Source
- Date
- Actuals | Forecast indicator (turned off by default)
- Headers can be merged when applicable
See more details under the Report Column Customization Help Center article.
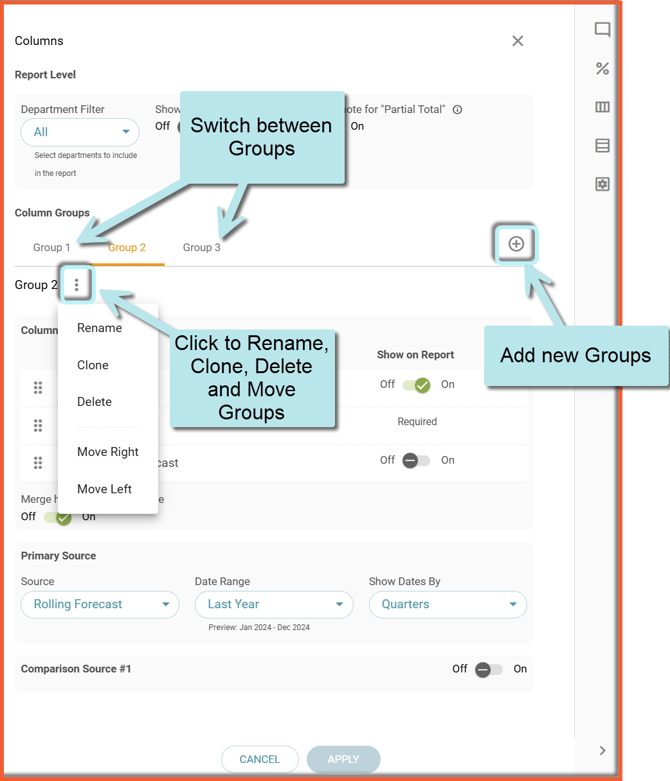
Report Multi-Column Groups Customization (related to ![]() Section) where
Section) where
- New Report Groups can be created
- Report Groups can be managed through the following actions:
- Renamee
- Clone
- Delete
- Move Right / Left
See more details under the Customize Report Multi-Column Groups Help Center article.