This article walks through the steps of adding the following metrics to an Executive Summary or Custom Report type - learn how to add these types of reports by visiting our Help articles on building Report Packages & Custom Report & Executive Summary Customization.
- Change in Cash
- Operating Cash Flow
- Investing Cash Flow
- Financing Cash Flow
Check out our Blog Post on using custom lines and global drivers for different runway calculations
Step 1:
Go to Setup ⚙️> Custom Tables and create a Custom Section named "Change in Cash" with three Reference rows for each Cash Flow Statement activity with a Subtotal for the Section - see the screenshot below.
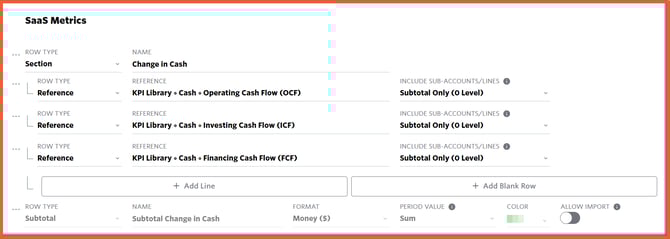
Check out this Help Article for further details on how to create a Section under Custom Table.
Step 2:
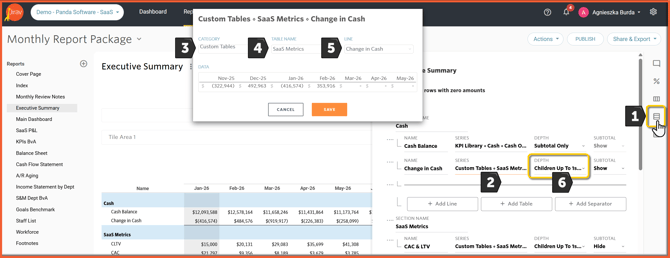
Add the detail to your Report; refer to our Help article on setting up your Executive Summary on how to add this detail to your Report.
Below is a screenshot of the configuration of the report:
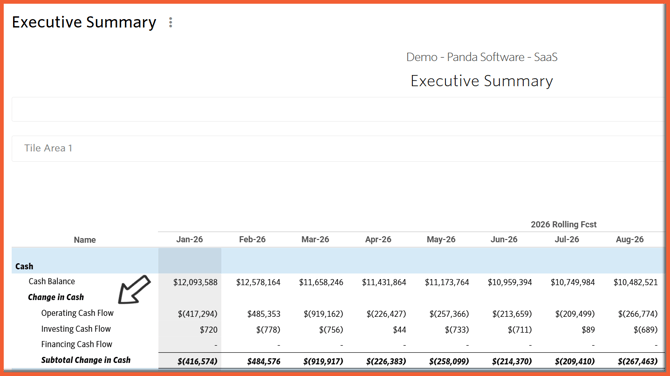
Below is a screenshot of the report:
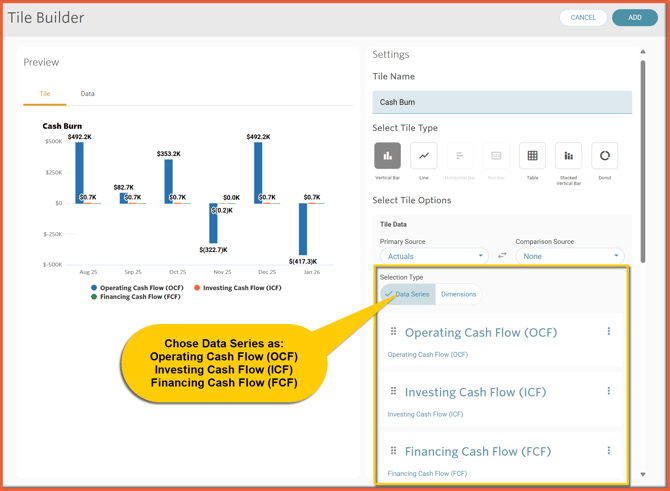
We can also create a "Cash Burn" Dashboard Tile by choosing Data Series as Operating Cash Flow (OCF), Investing Cash Flow (ICF) and Financing Cash Flow (FCF) - all coming from the KPI Library:
For a detailed article on how to work with Dashboard Tiles please see this Help article.