Dashboards are powerful tools that enable you to effectively communicate information and insights using a wide range of visually captivating and customizable charts and tables referred to as tiles. Whether you need to showcase sales figures, track project progress, or visualize financial data, dashboards provide a visually appealing and organized way to present data, making it easy for users to understand and analyze information at a glance.
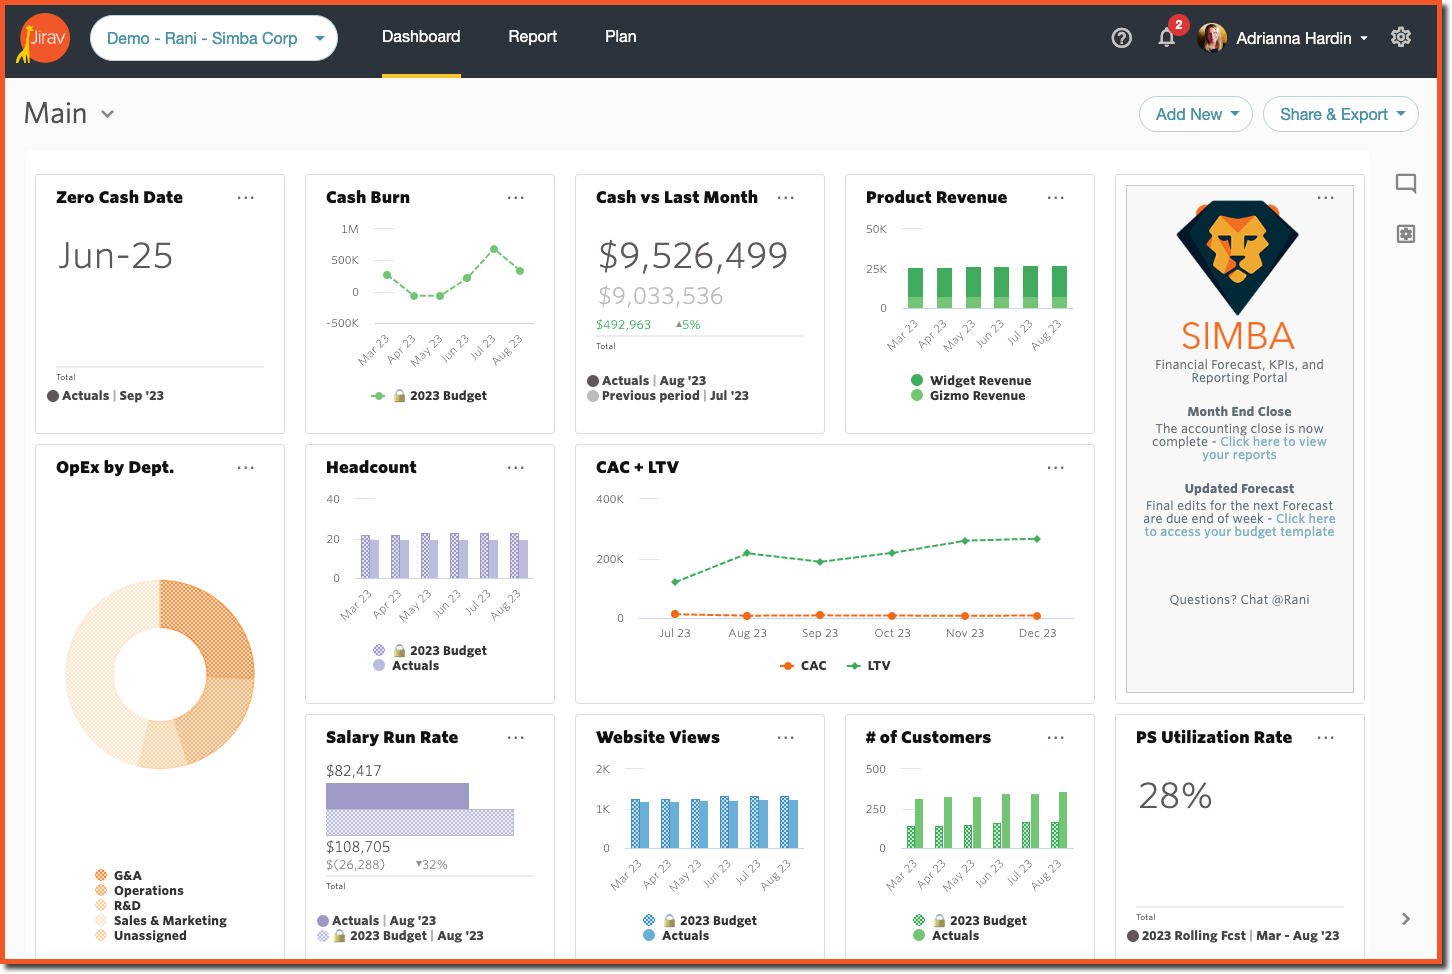
Utilize Dashboards & Tiles to customize your views, then share the results.
Dashboards
Customize your dashboards to create visually appealing representations of relevant data for different teams and departments. For instance, you could design a Company Overview Dashboard that showcases key performance indicators like profitability margins. Additionally, you could create a department-specific Marketing dashboard, which includes metrics such as Budget vs Actuals, Ad Spend, MQLs, and SQLs.
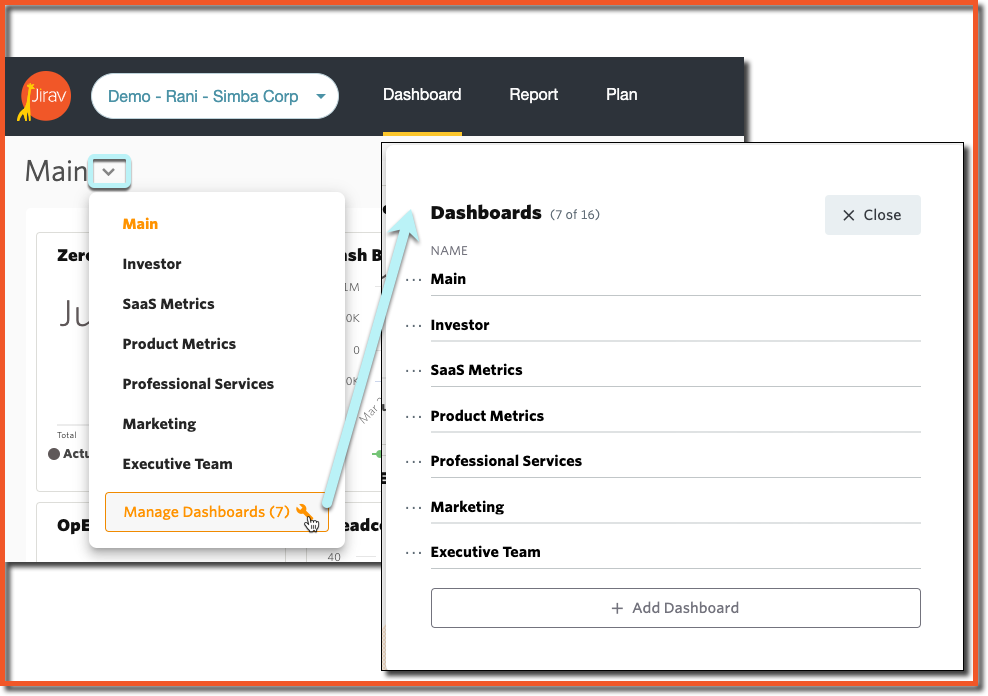
To view existing dashboards or to add a new dashboard, go to Dashboard > Select the ∨ next to the currently selected dashboard name to open the context menu and select Manage Dashboards.
Helpful Hints:
- Customize your dashboards by creating separate ones for different audiences. This allows you to easily and effectively share information with the right people.
- A Dashboard can be included as a section within a Report Template.
Tiles
Tiles in the dashboard area present data in an appealing format. You can use various types of tiles to create interactive and visually dynamic dashboards that cater specifically to your needs.
There are seven different standard tile types:
- Vertical Bar Tile
- Line Tile
- Horizontal Bar Tile
- Number Tile
- Table Tile
- Stacked Vertical Bar Tile
- Donut Tile
Additionally, there are the following special tiles:
Tiles can either be updated individually or in bulk.
Individual Tile Updates
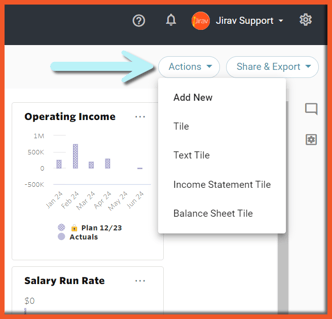
To add a new tile to a dashboard, click on the "Actions" button located at the top right corner of the dashboard.
Next, populate the Tile Name [1] and choose one of the seven standard Tile Types [2] that best fits your needs.
Now, you can select the Tile Data: Primary Source and Comparison Source [3] and the right Selection Type: Data Series or Dimensions [4].
The next step is customizing the Tile Date [5]: adjust the Date Range that should be displayed in the Tile, Show Dates as Monthly, Quarterly, Yearly or Total (available options depend on the Tile Type) and Show Actuals Until Max to display all Actuals available in your Account or Close Month to display Actuals only up until the set close month.

To move a tile, simply drag and drop it to the new location. Other tiles will automatically rearrange to fill in any gaps created by the move.
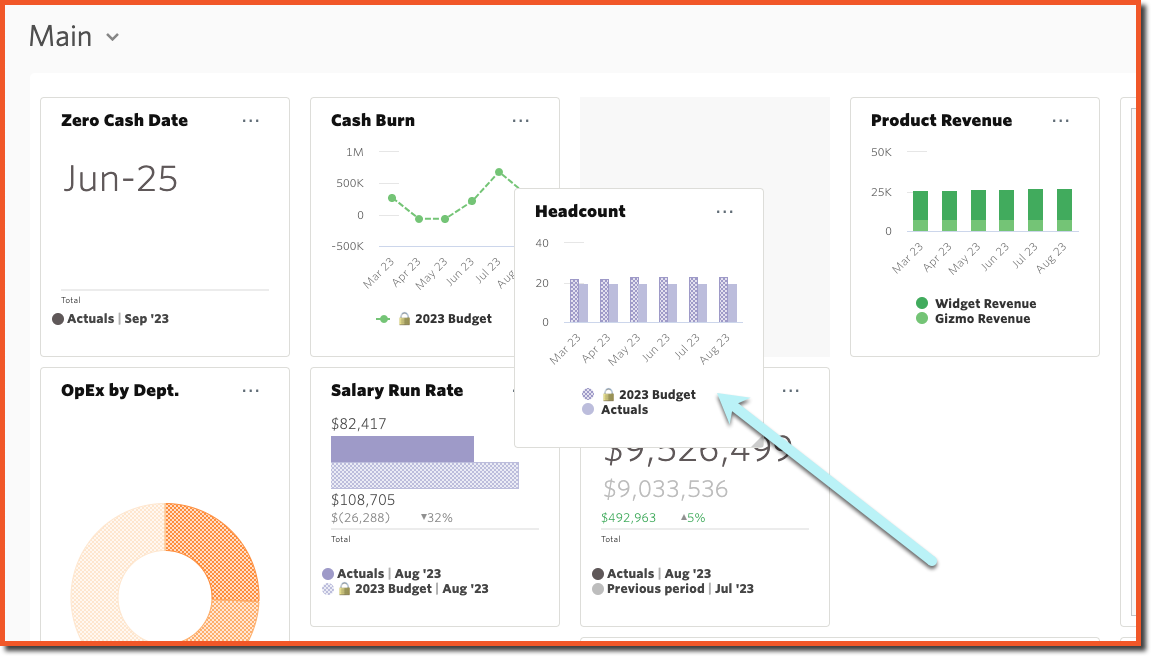
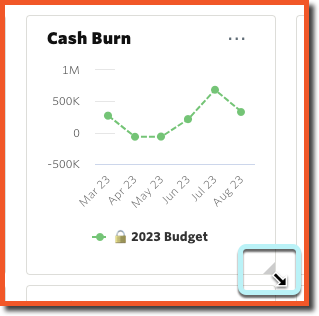
To resize a tile, simply click the bottom right corner of the tile and drag it outwards or inwards to resize. Other tiles will automatically rearrange to fill in any gaps created by the resize.
Select the ellipsis (...) from the top right of the desired tile to access a context menu specific to the individual tile to edit, clone, delete, export, or view the tile full screen.
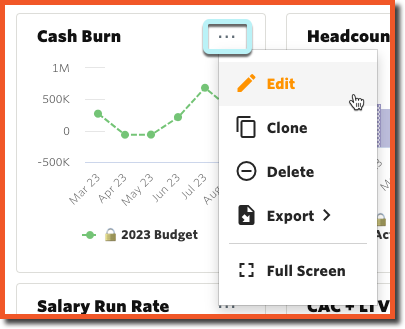
- Edit: Populate the Tile Name and then use the drop-down selections to choose what data will be pulled into the tile.
- Clone: Creates an exact replica of an existing tile at a specific point in time. Once created, the cloned tile becomes independent from the original tile, meaning any changes made to the original tile will not affect the cloned tile or vice versa.
- Delete: Permanently remove the tile from the dashboard. This action cannot be undone. However, the data that the tile was displaying still exists in the database and is not tied to the individual tile. So, you can easily create a new tile to display the same data.
- Export: Export individual tiles to embed into your presentations or external documents as either a PNG image (.png), PDF document (.pdf), SVG image (.svg), or Comma Separated Values (.csv) format.
Bulk Tile Updates
To make bulk edits to your dashboard tiles, select the Edit Dashboard gear icon on the right side of the screen.

The Edit Dashboard screen enables quick updating to multiple tiles, including the Source, the Compared to Source, Periodicity, and Range.

Select the top-most checkbox to select all tiles to update, or select individual checkboxes to update specific tiles. The column-level settings in the first will be activated. In the example below, the Current POR was selected for the Compared to Source and the Apply button is then activated.

After selecting Apply, the tiles in which the changes will be saved are highlighted. Additional changes can be made, or select Save to save the changes and go back to the Dashboard.

Note that fields that are not available to update through the Edit Dashboard screen are marked as N/A. Dashboard tiles cannot be added, moved, or deleted from the Edit Dashboard screen.
See another example of Bulk Editing a Dashboard:

Sharing
Sharing a Dashboard grants users access to live data, allowing them to stay informed with the latest information and empowering them to make informed decisions based on the most recent insights.
Dashboards can be shared with individual users or groups of users.
To share your Dashboard, simply select the "Share & Export" button in the upper-right-hand corner and select the user or group of users you'd like to share the Dashboard with. Optionally include a message. This action will send an email to the user(s) selected with a link to access the Dashboard. The user(s) will only be able to see what you have explicitly shared with them.
Alternatively, a dashboard can be exported to PDF and shared outside of Jirav.

Helpful Hint:
Set the Range on tiles to a dynamic month so that they always display the latest, greatest data. For example, if you have set the range to "Close Month", you can ensure users are only seeing actuals for the latest closed month.
Unshare a Dashboard
Begin by selecting the "Share" button:

You can then see who the Dashboard or Report has been shared with:

Click on the names listed and the following pop up will appear. You can then either manage the users, send a reminder, or remove a user that is only a basic user type:

Visual Comment Alerts
Receive visual alerts indicating the number of unread comments across all sections of the application - once viewed, the visual alert will disappear.

Additional Resources: Dashboards & Tile Overview, Reports & Dashboards Video, Multiple Dashboards